Debunking The Myth That Search Is Dying
SEO Is Not Dying, The Pie Is Getting Bigger
Overview
When ChatGPT launched in November 2022, it caused dramatic changes in the landscapes of AI, search, and marketing. After only 2 months, ChatGPT became the fastest-growing consumer app in history. As of October 2025, ChatGPT sees over 800M weekly active users and 2.5B daily prompts (source), and many people now use ChatGPT to search and discover.
This raises the question: Is SEO dead?
The short answer is no. I argue that the narrative “SEO is Dead” is based on a series of myths driven by speculation, exaggeration, flawed analysis, and false information.
Key Takeaways
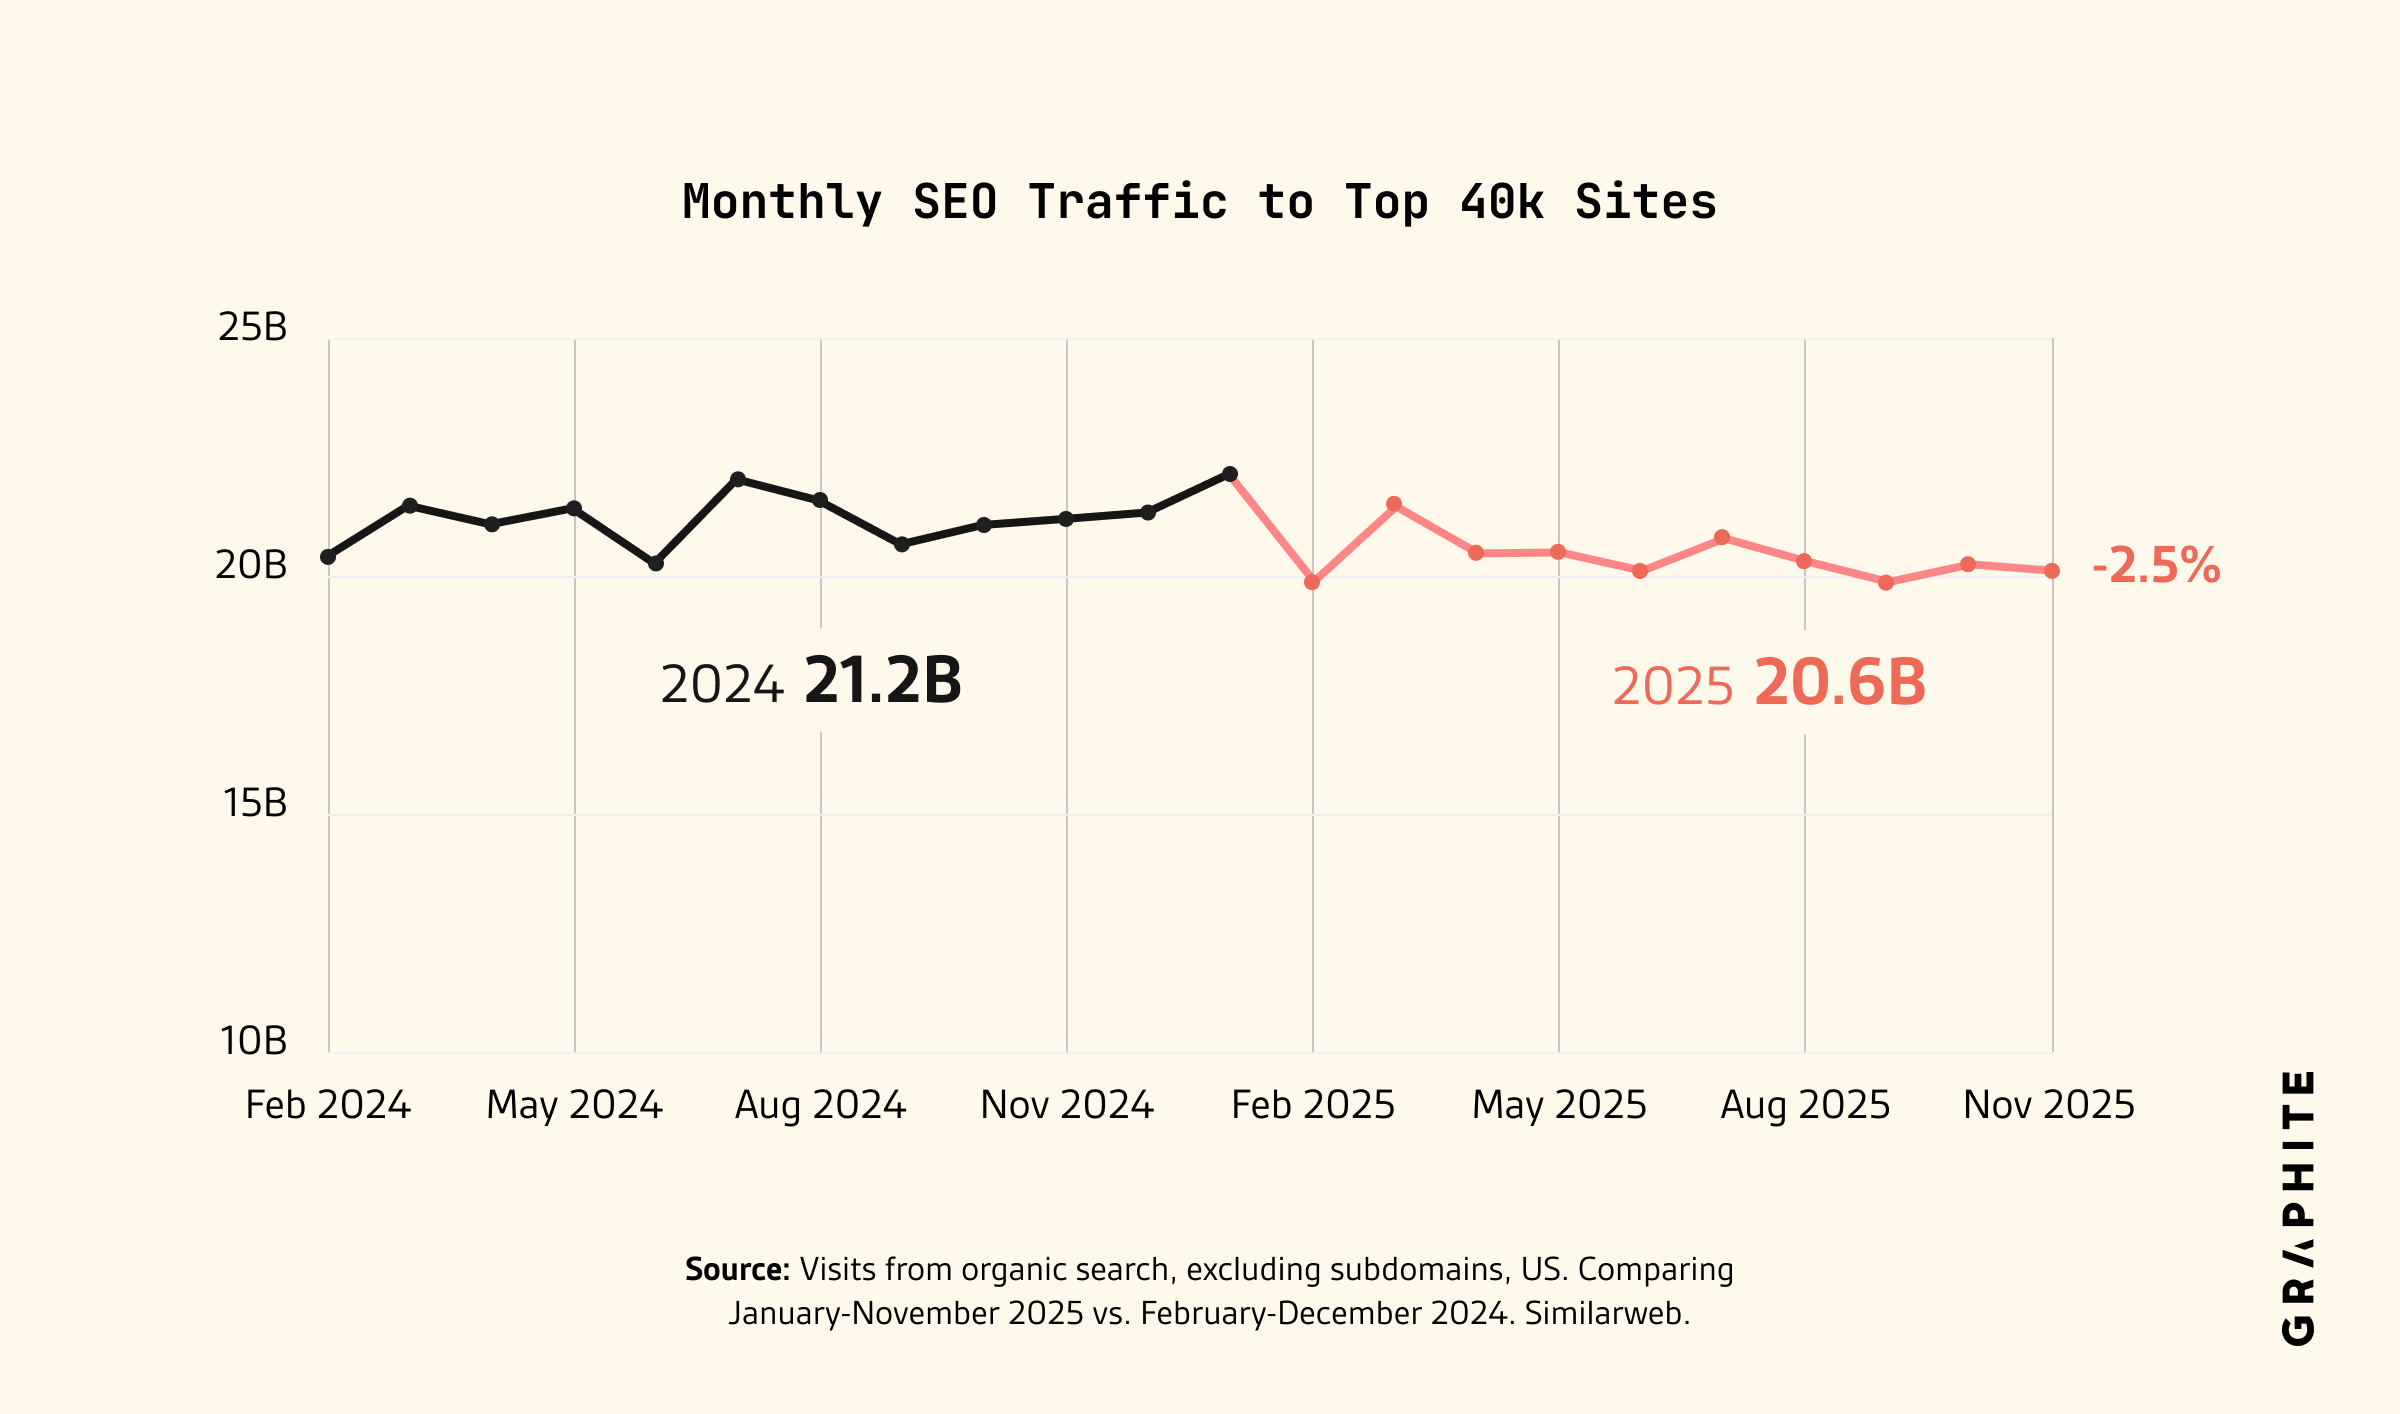
SEO traffic is down slightly (-2.5%), not dramatically.
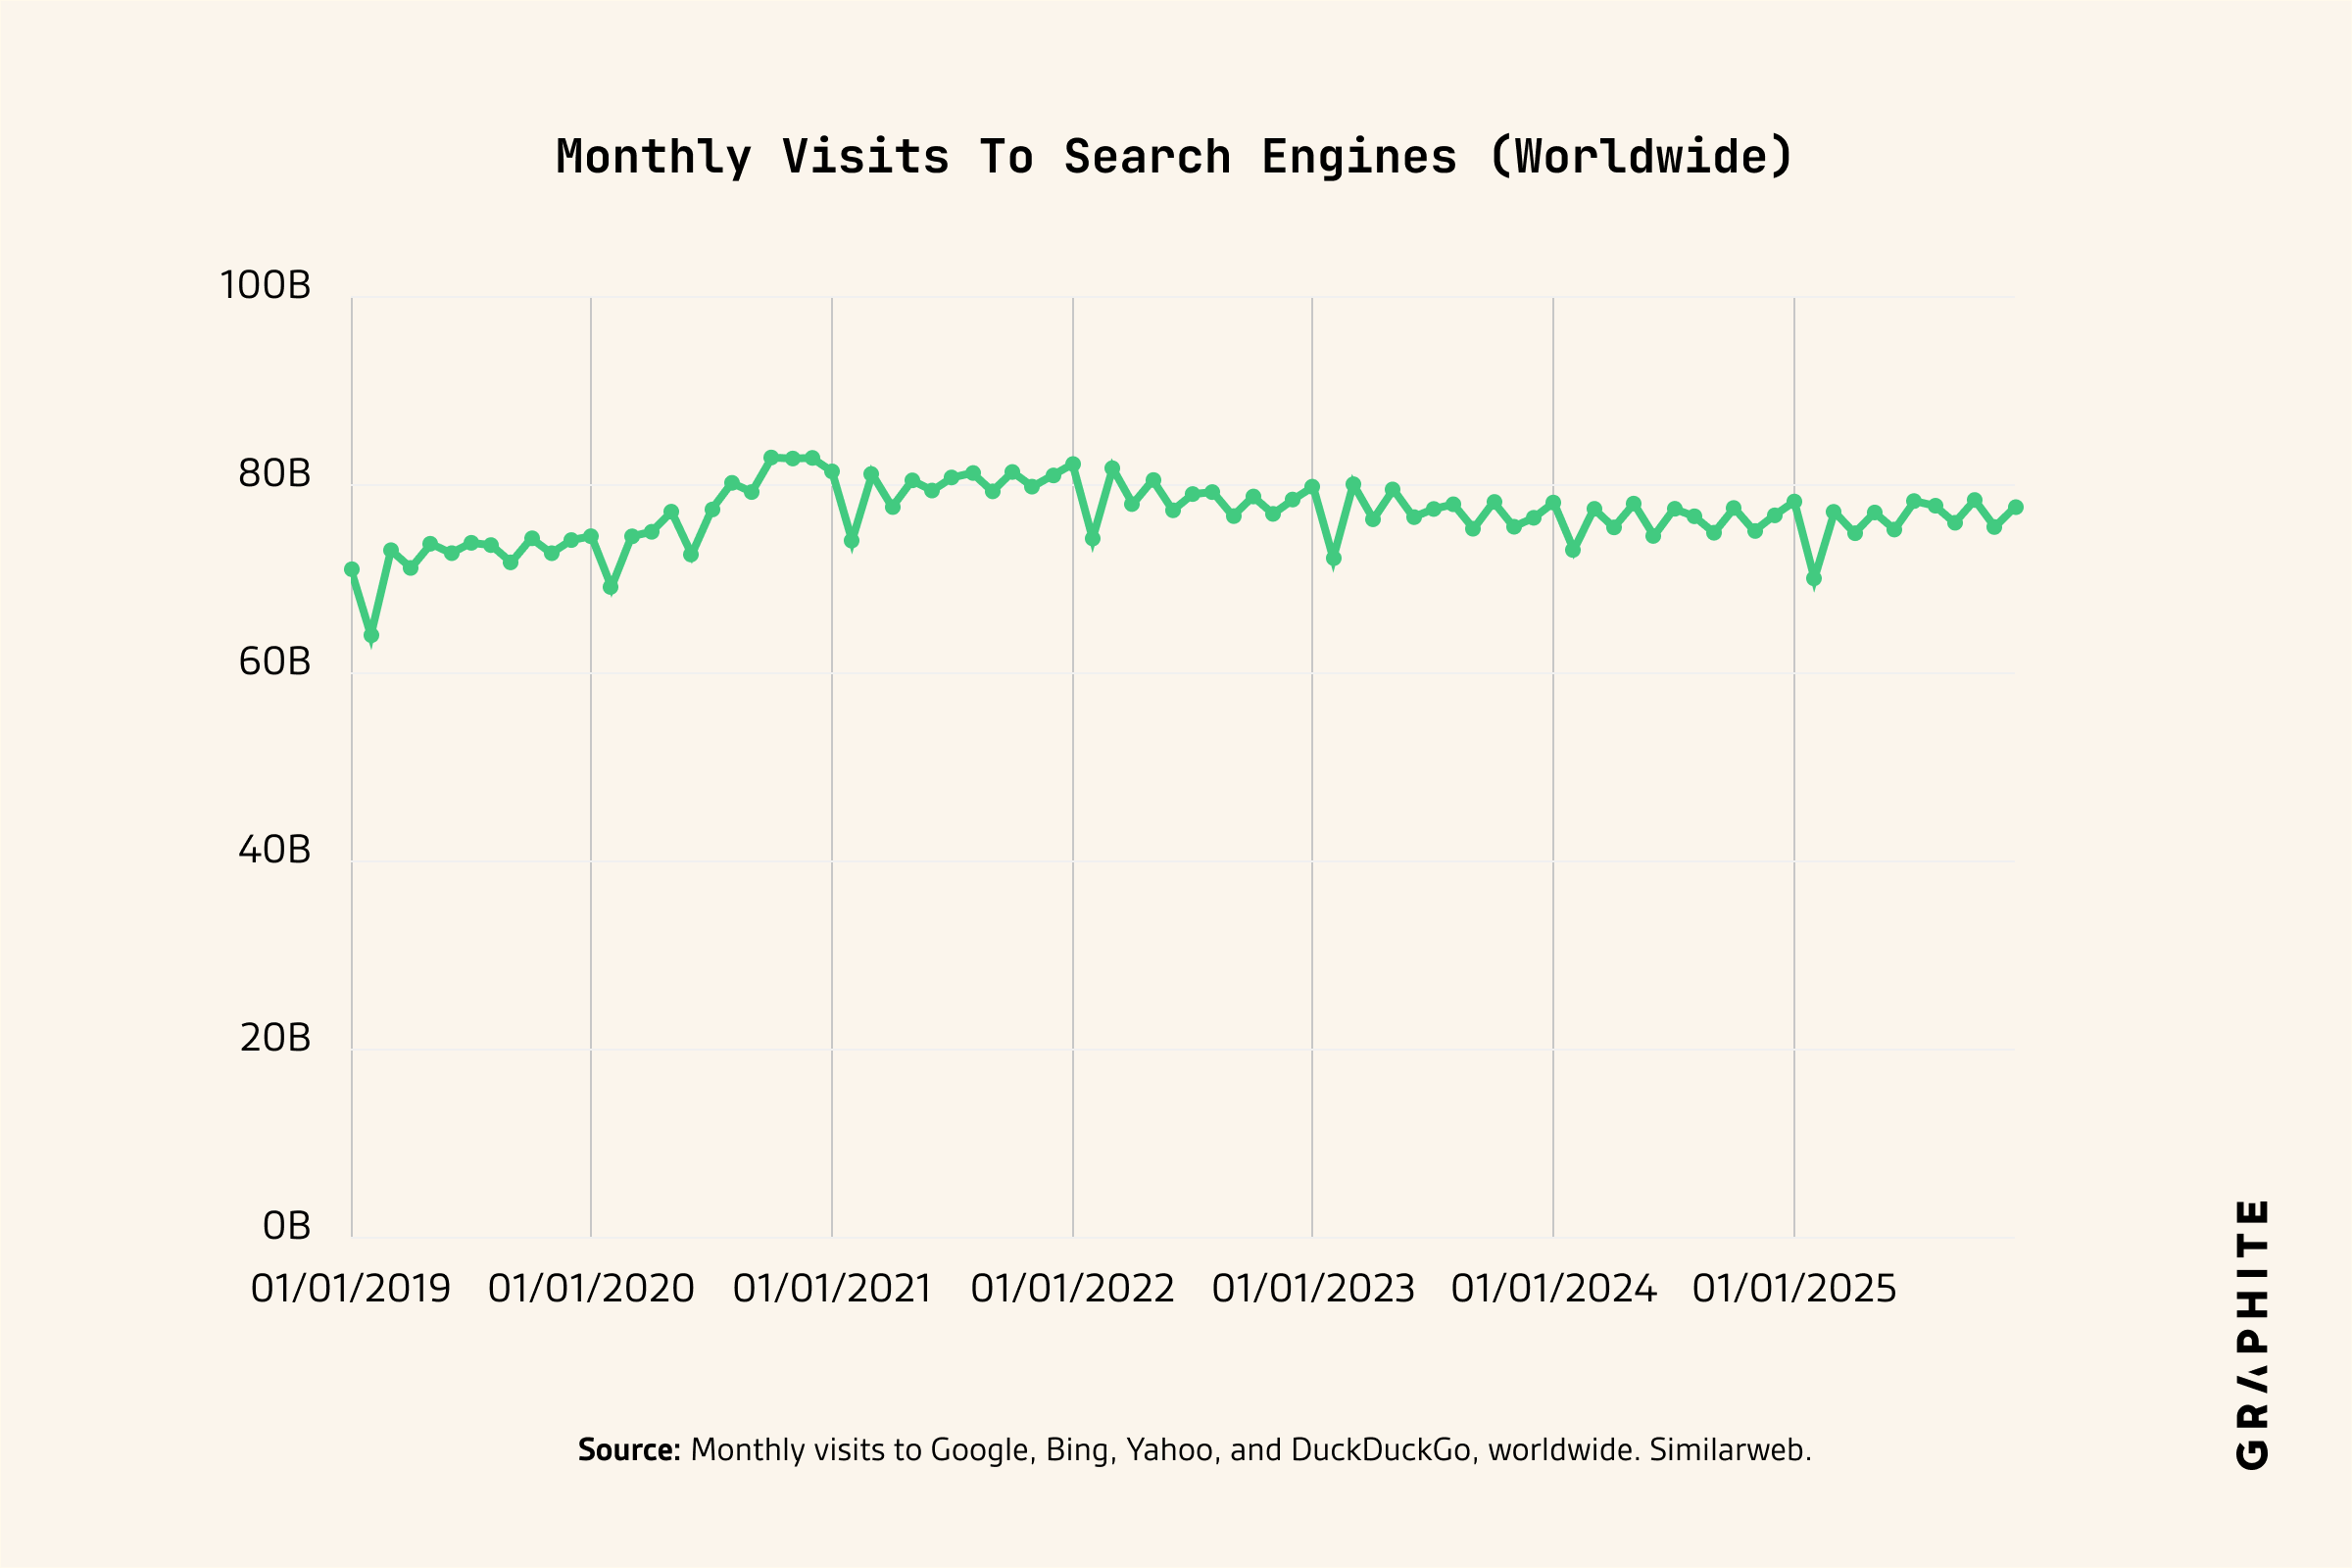
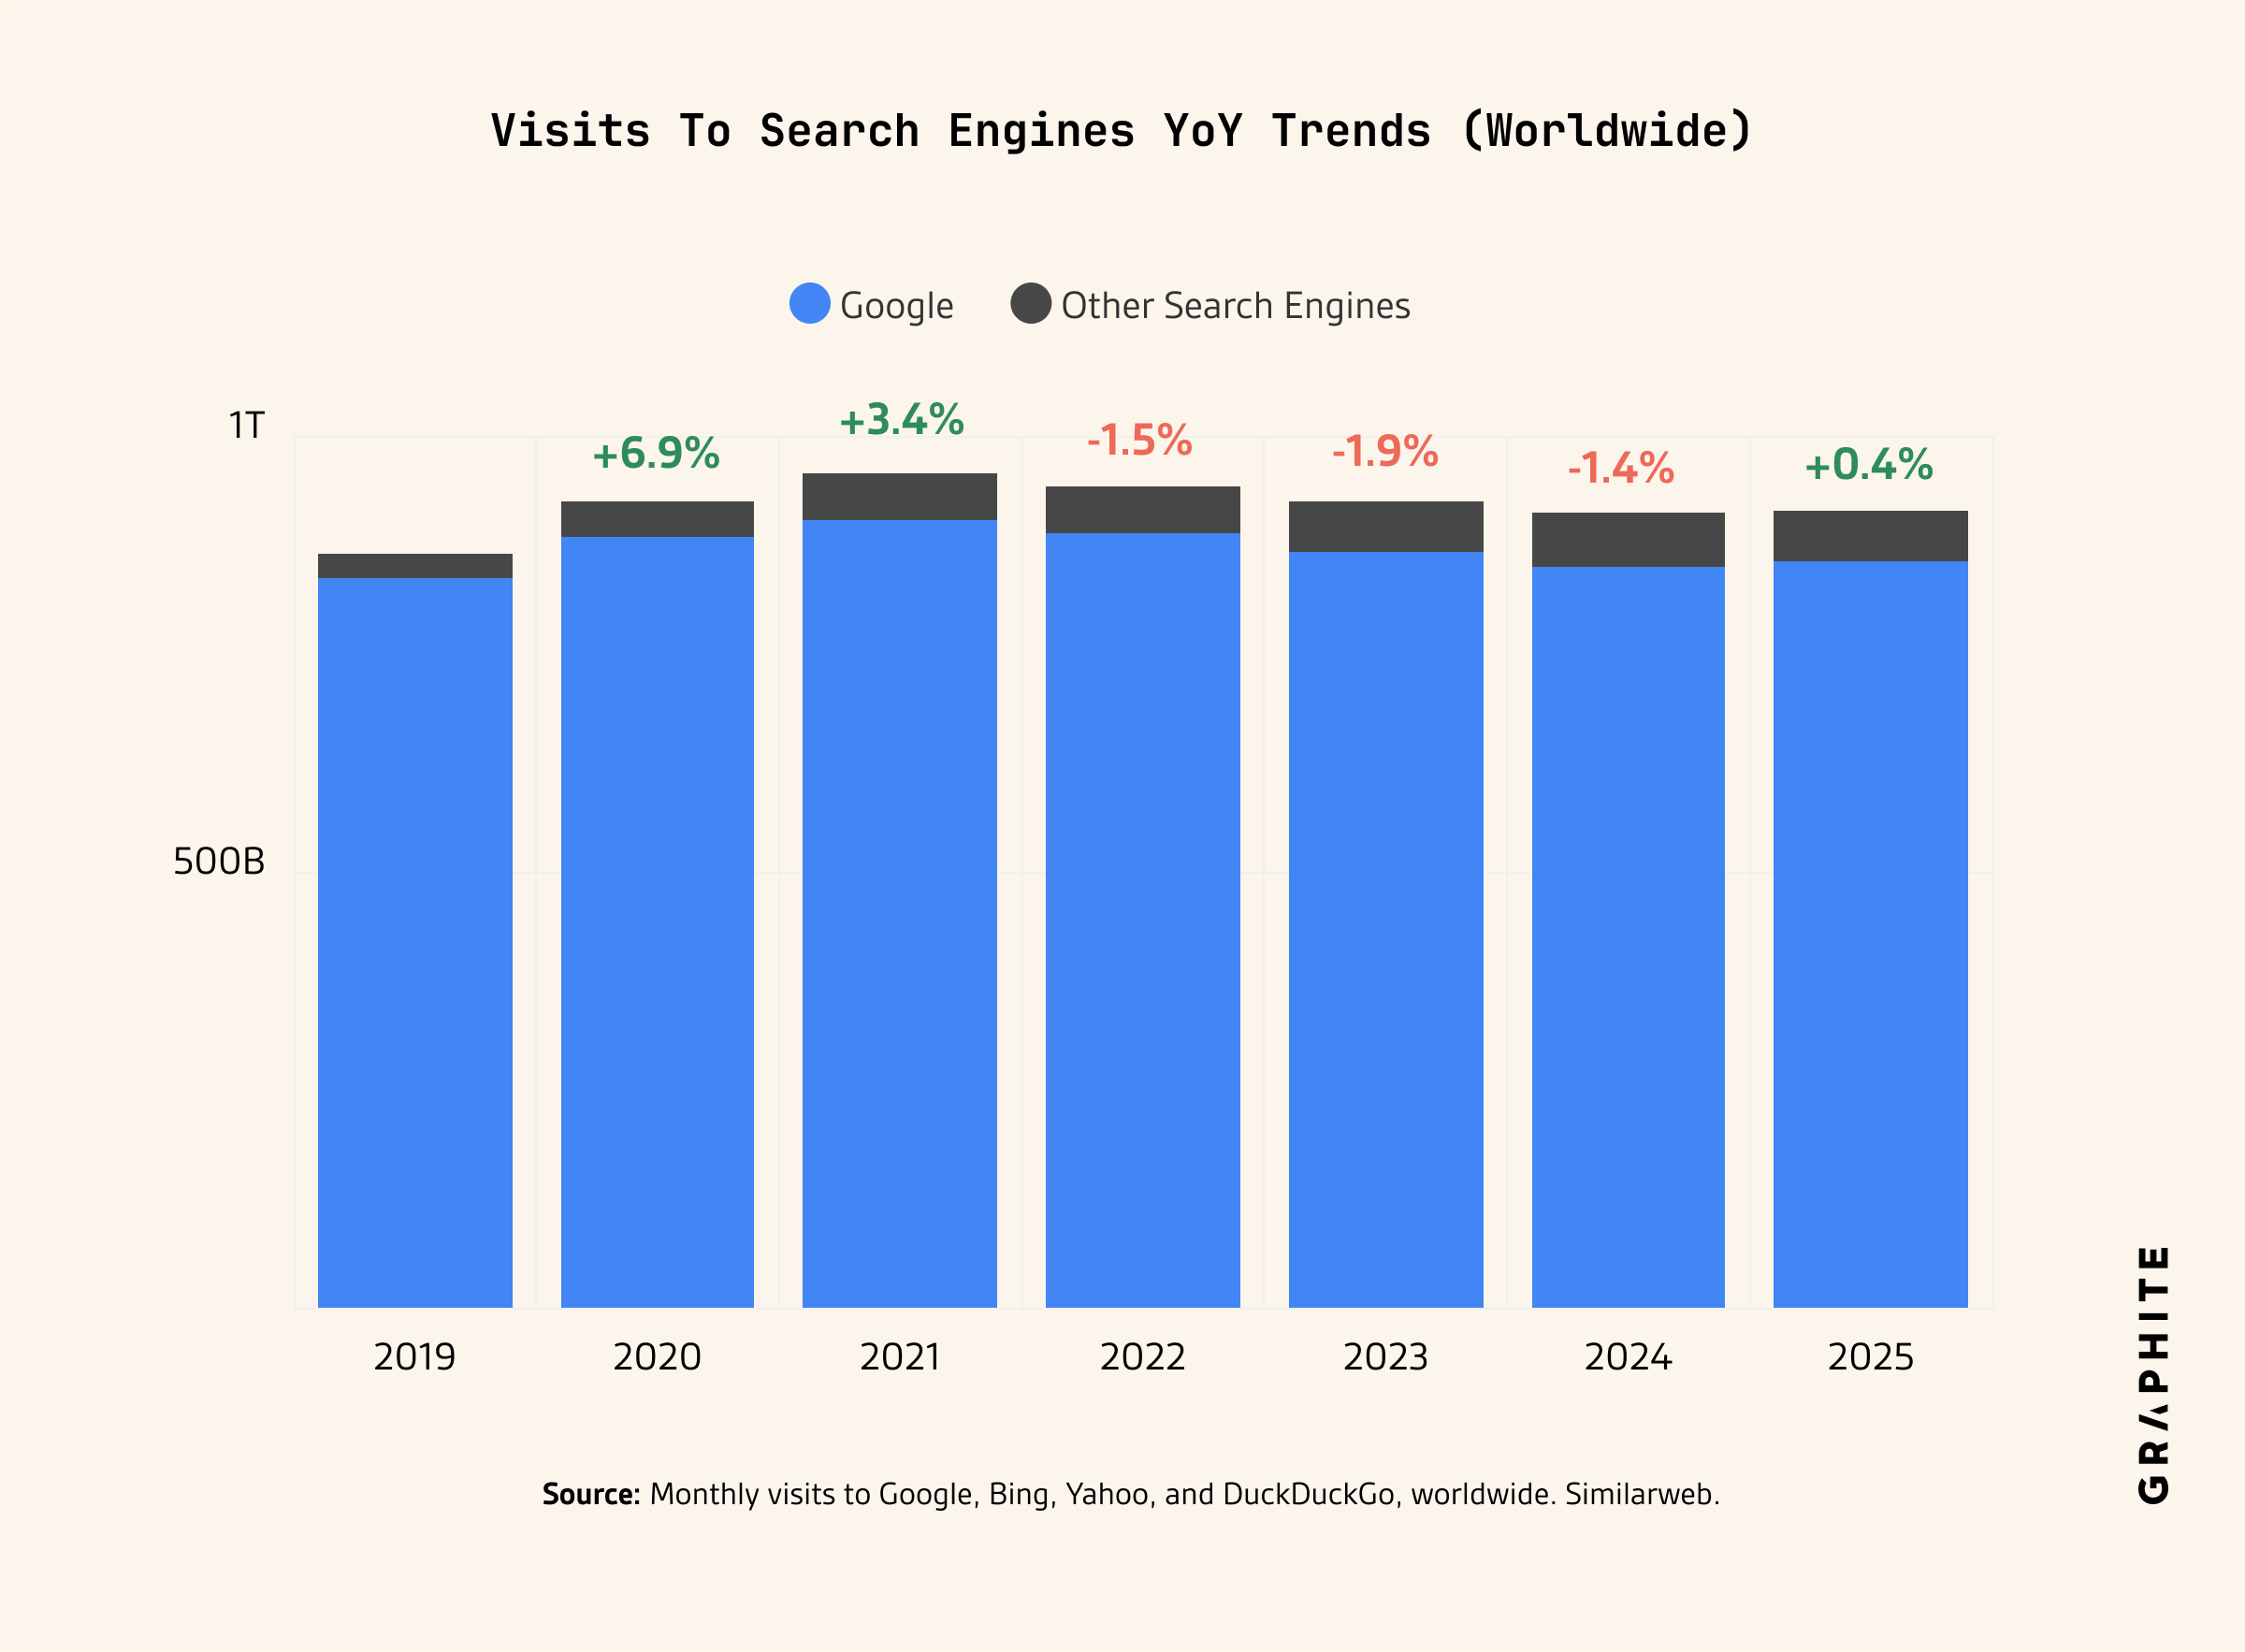
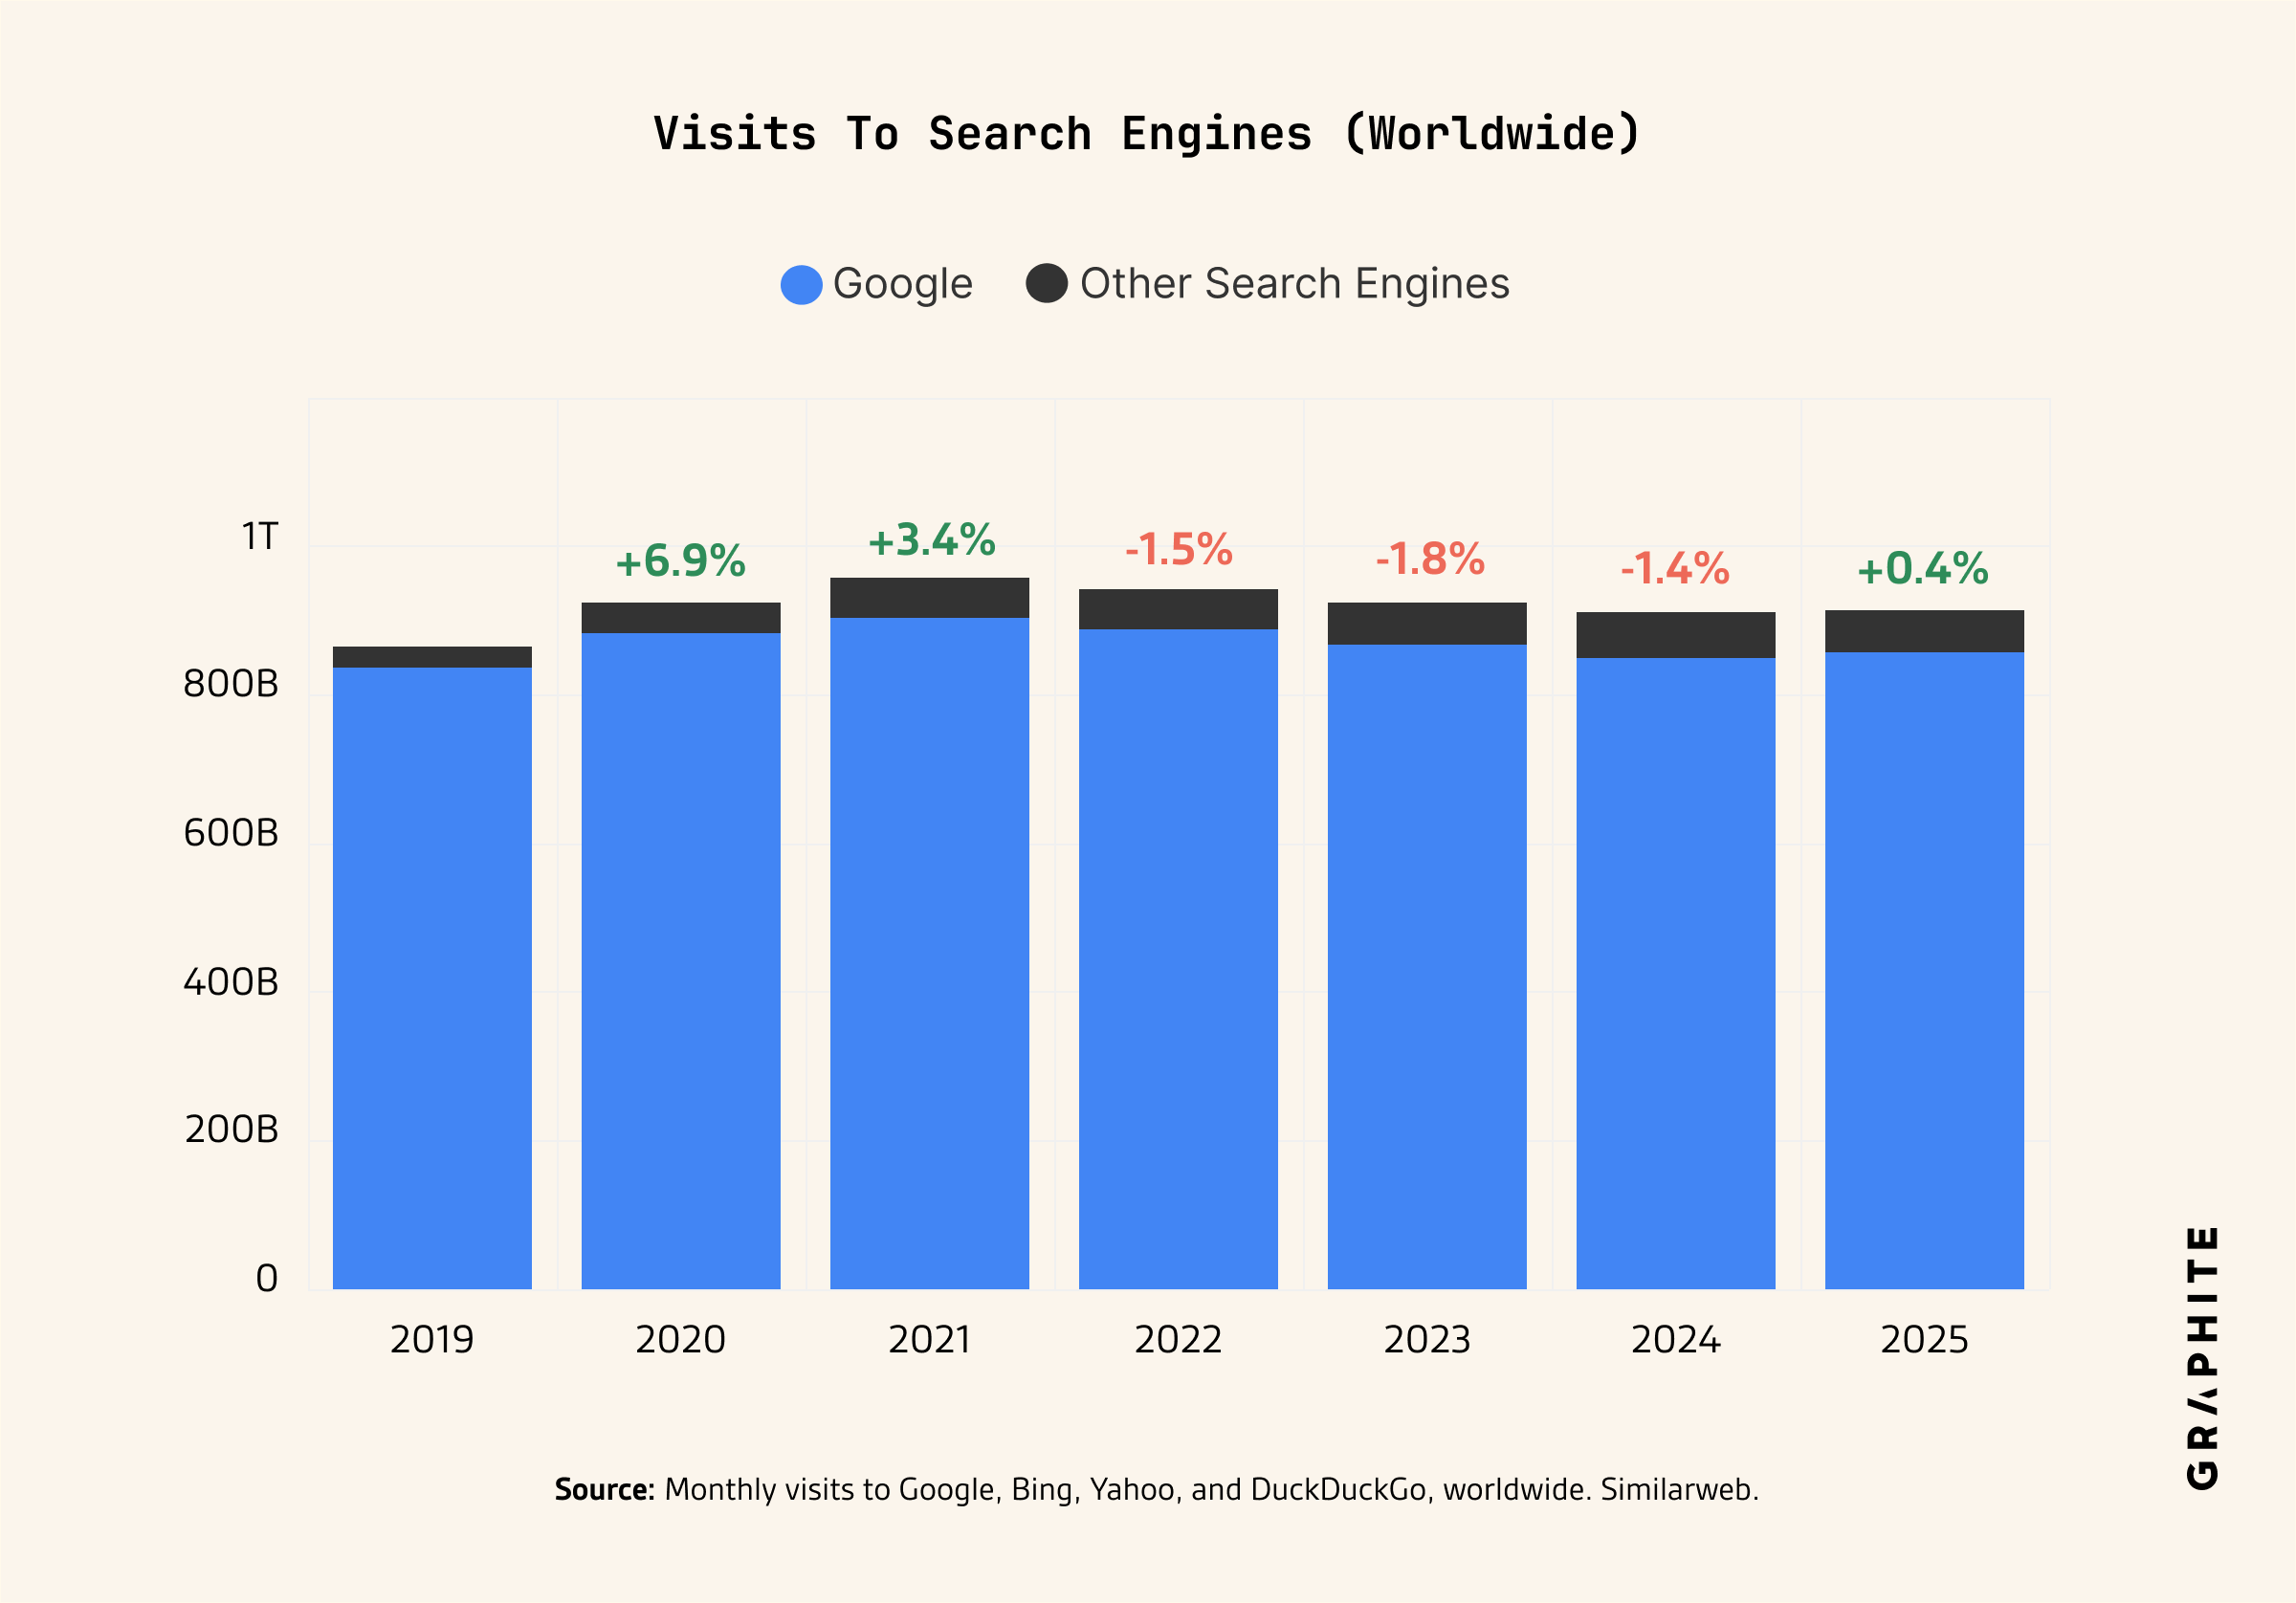
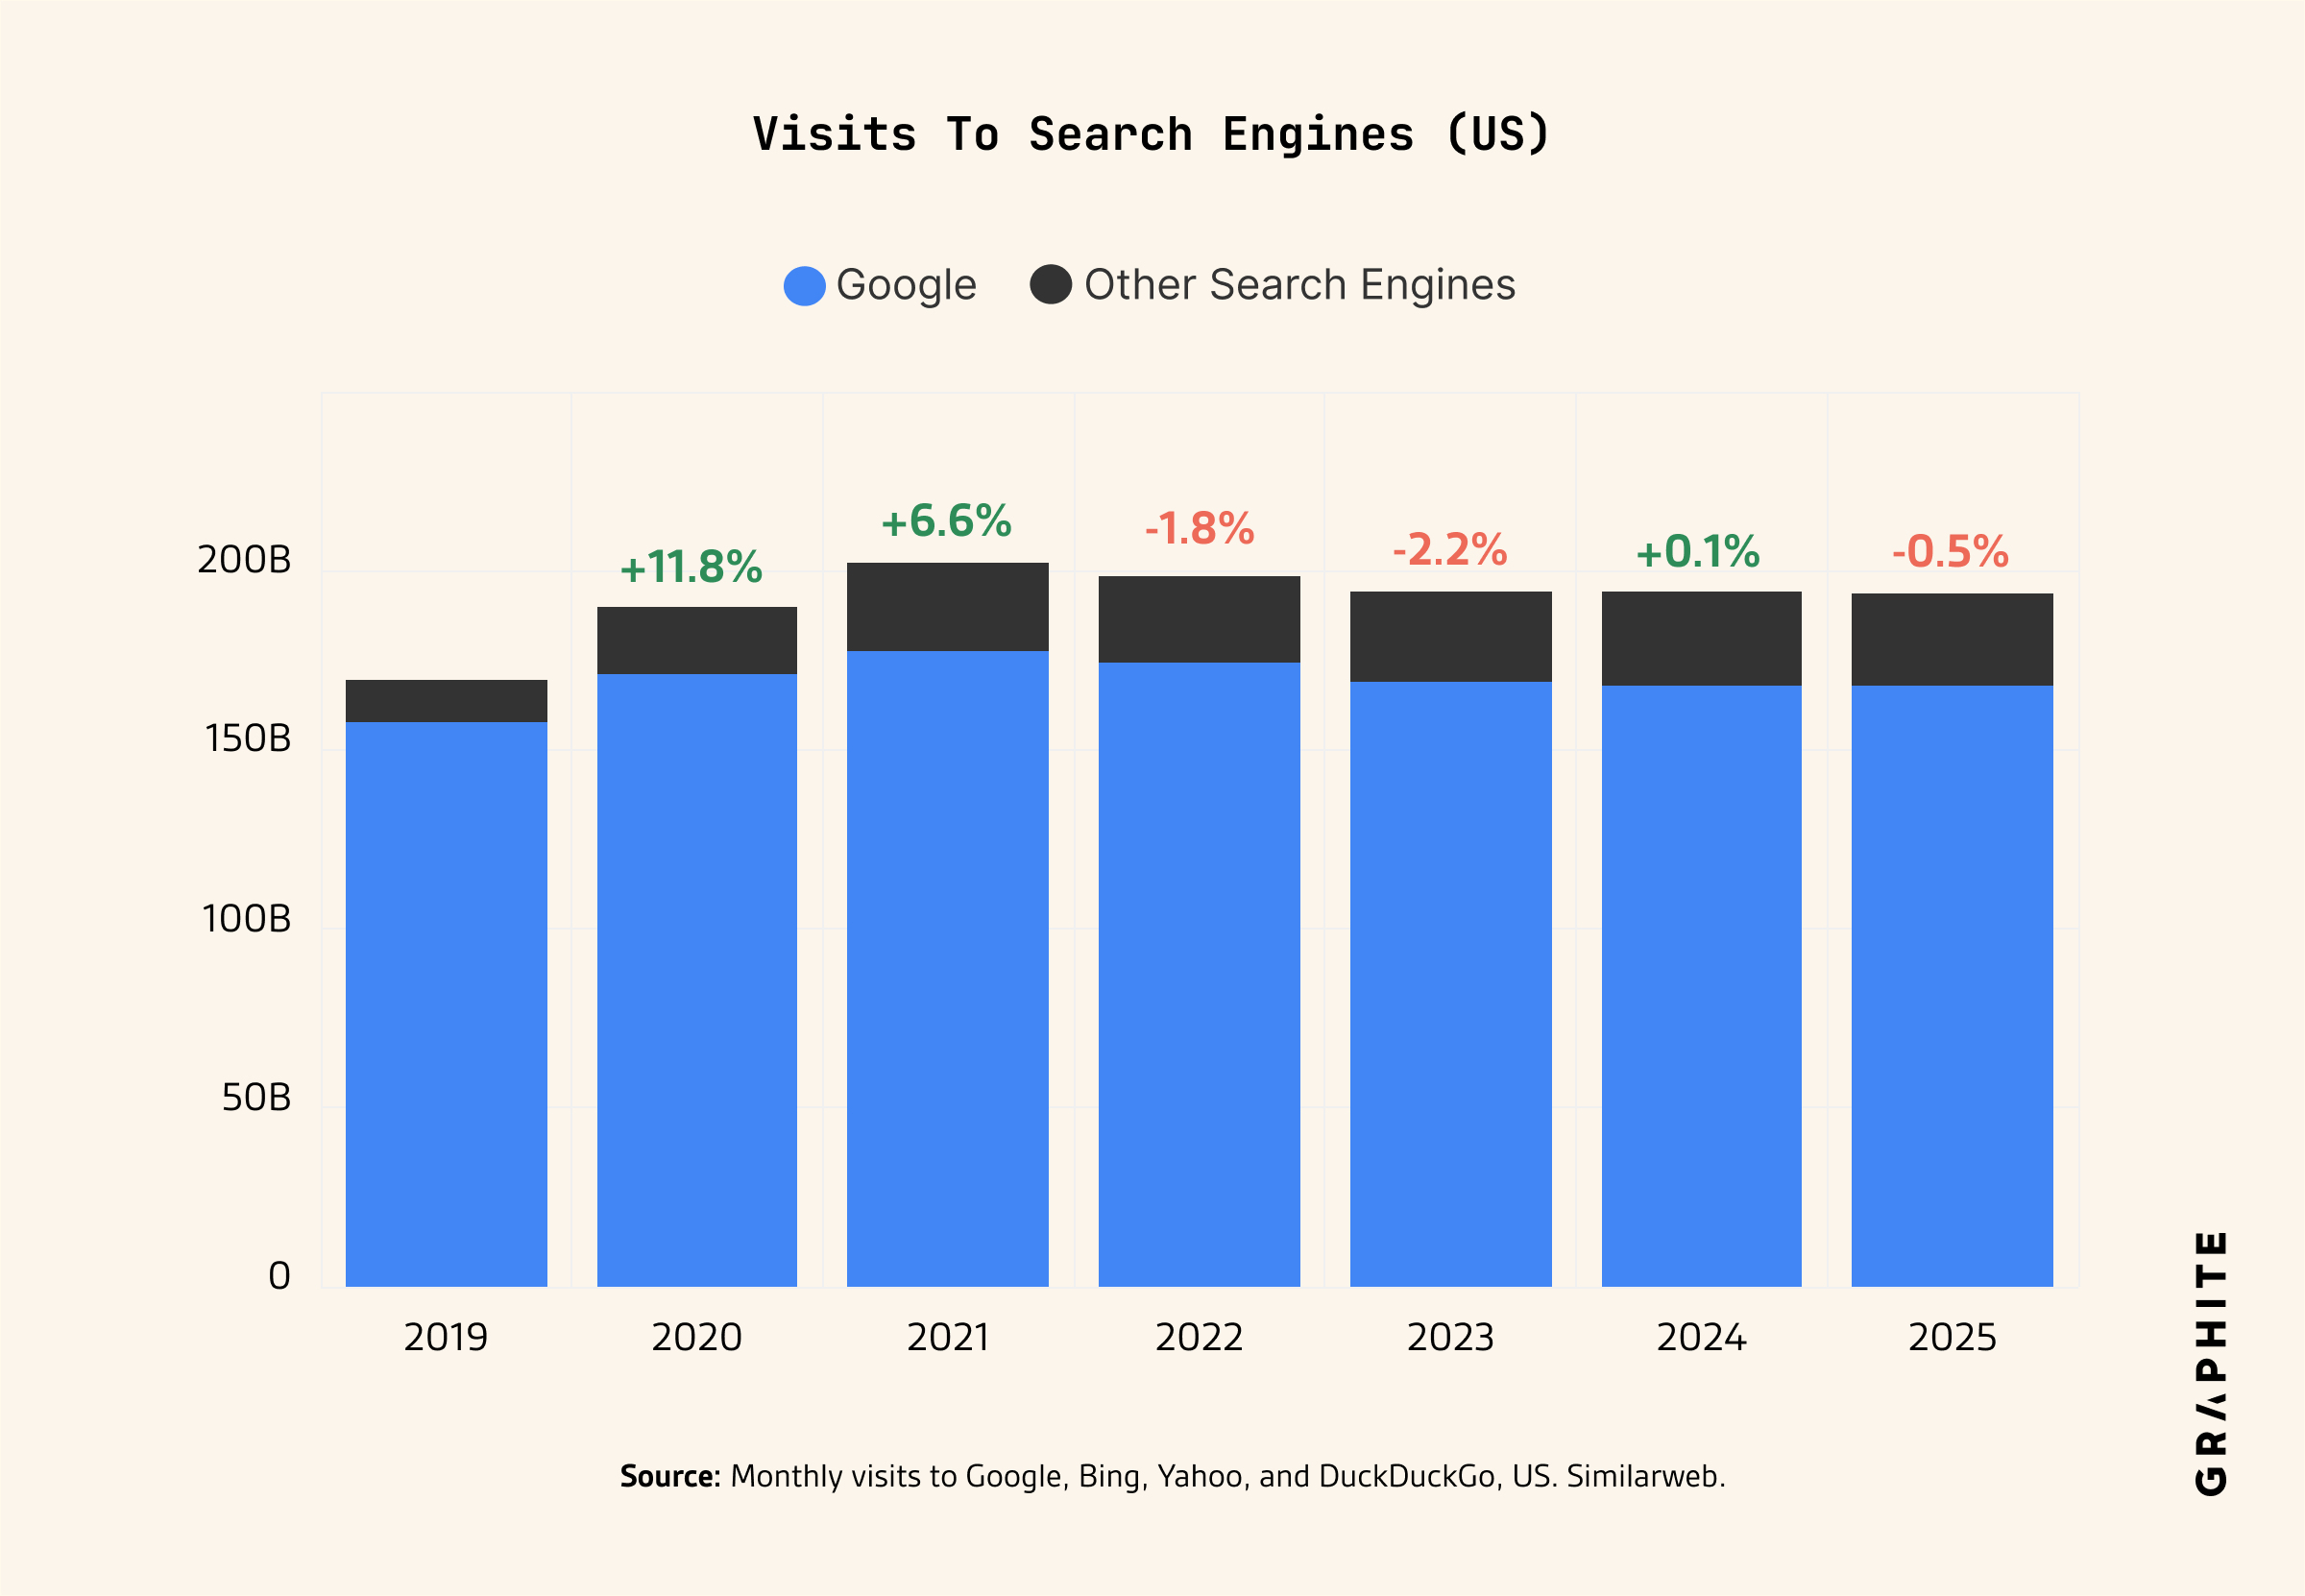
Traffic to search engines increased from 2019 to 2020 (+6.9%), decreased slightly in 2022 (-1.5%), and has been relatively flat since 2023 (-1.0%). In fact, traffic has increased slightly in 2025 to both Google (+0.8%) and search engines as a whole (+0.4%). Further, visitors to Google increased by +1.4% comparing Q4 2025 vs. 2024.
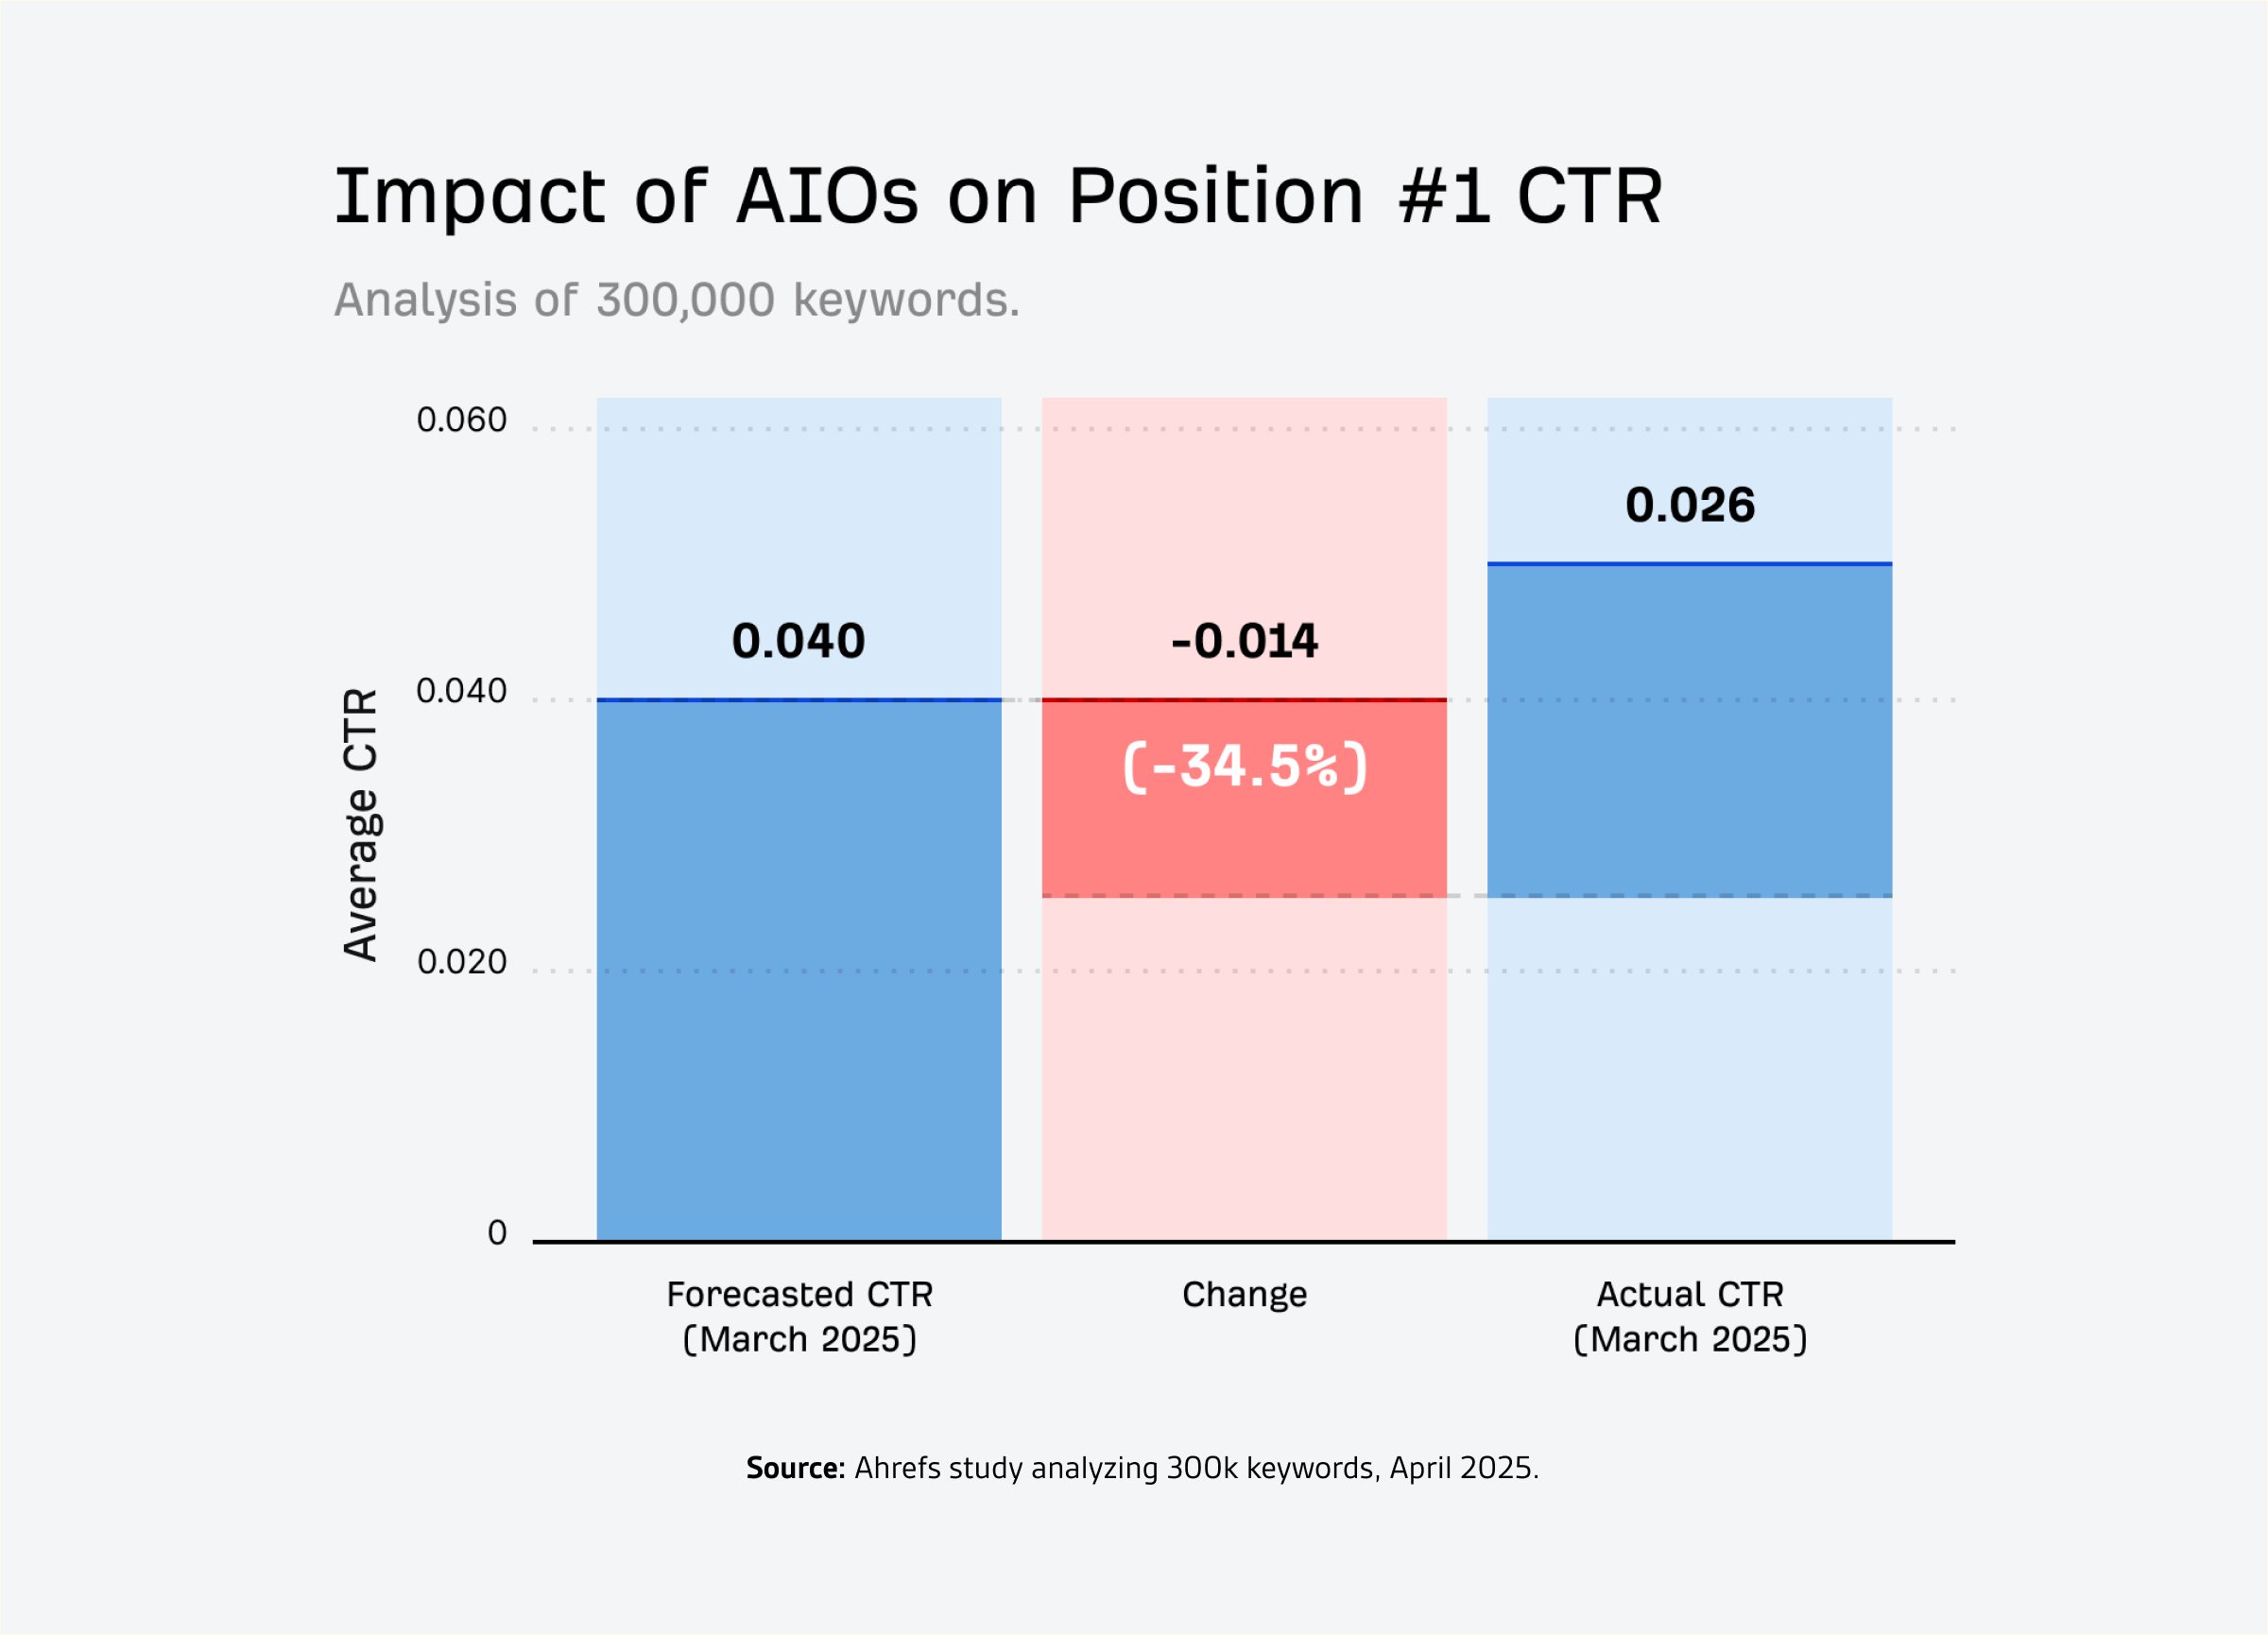
AI Overviews does decrease (-35%) click-through rates to organic results when present. However, AI Overviews only appear roughly 30% of the time. In 80% of cases, prior to AI Overviews, Google showed Featured Snippets, which also reduced click-through rate.
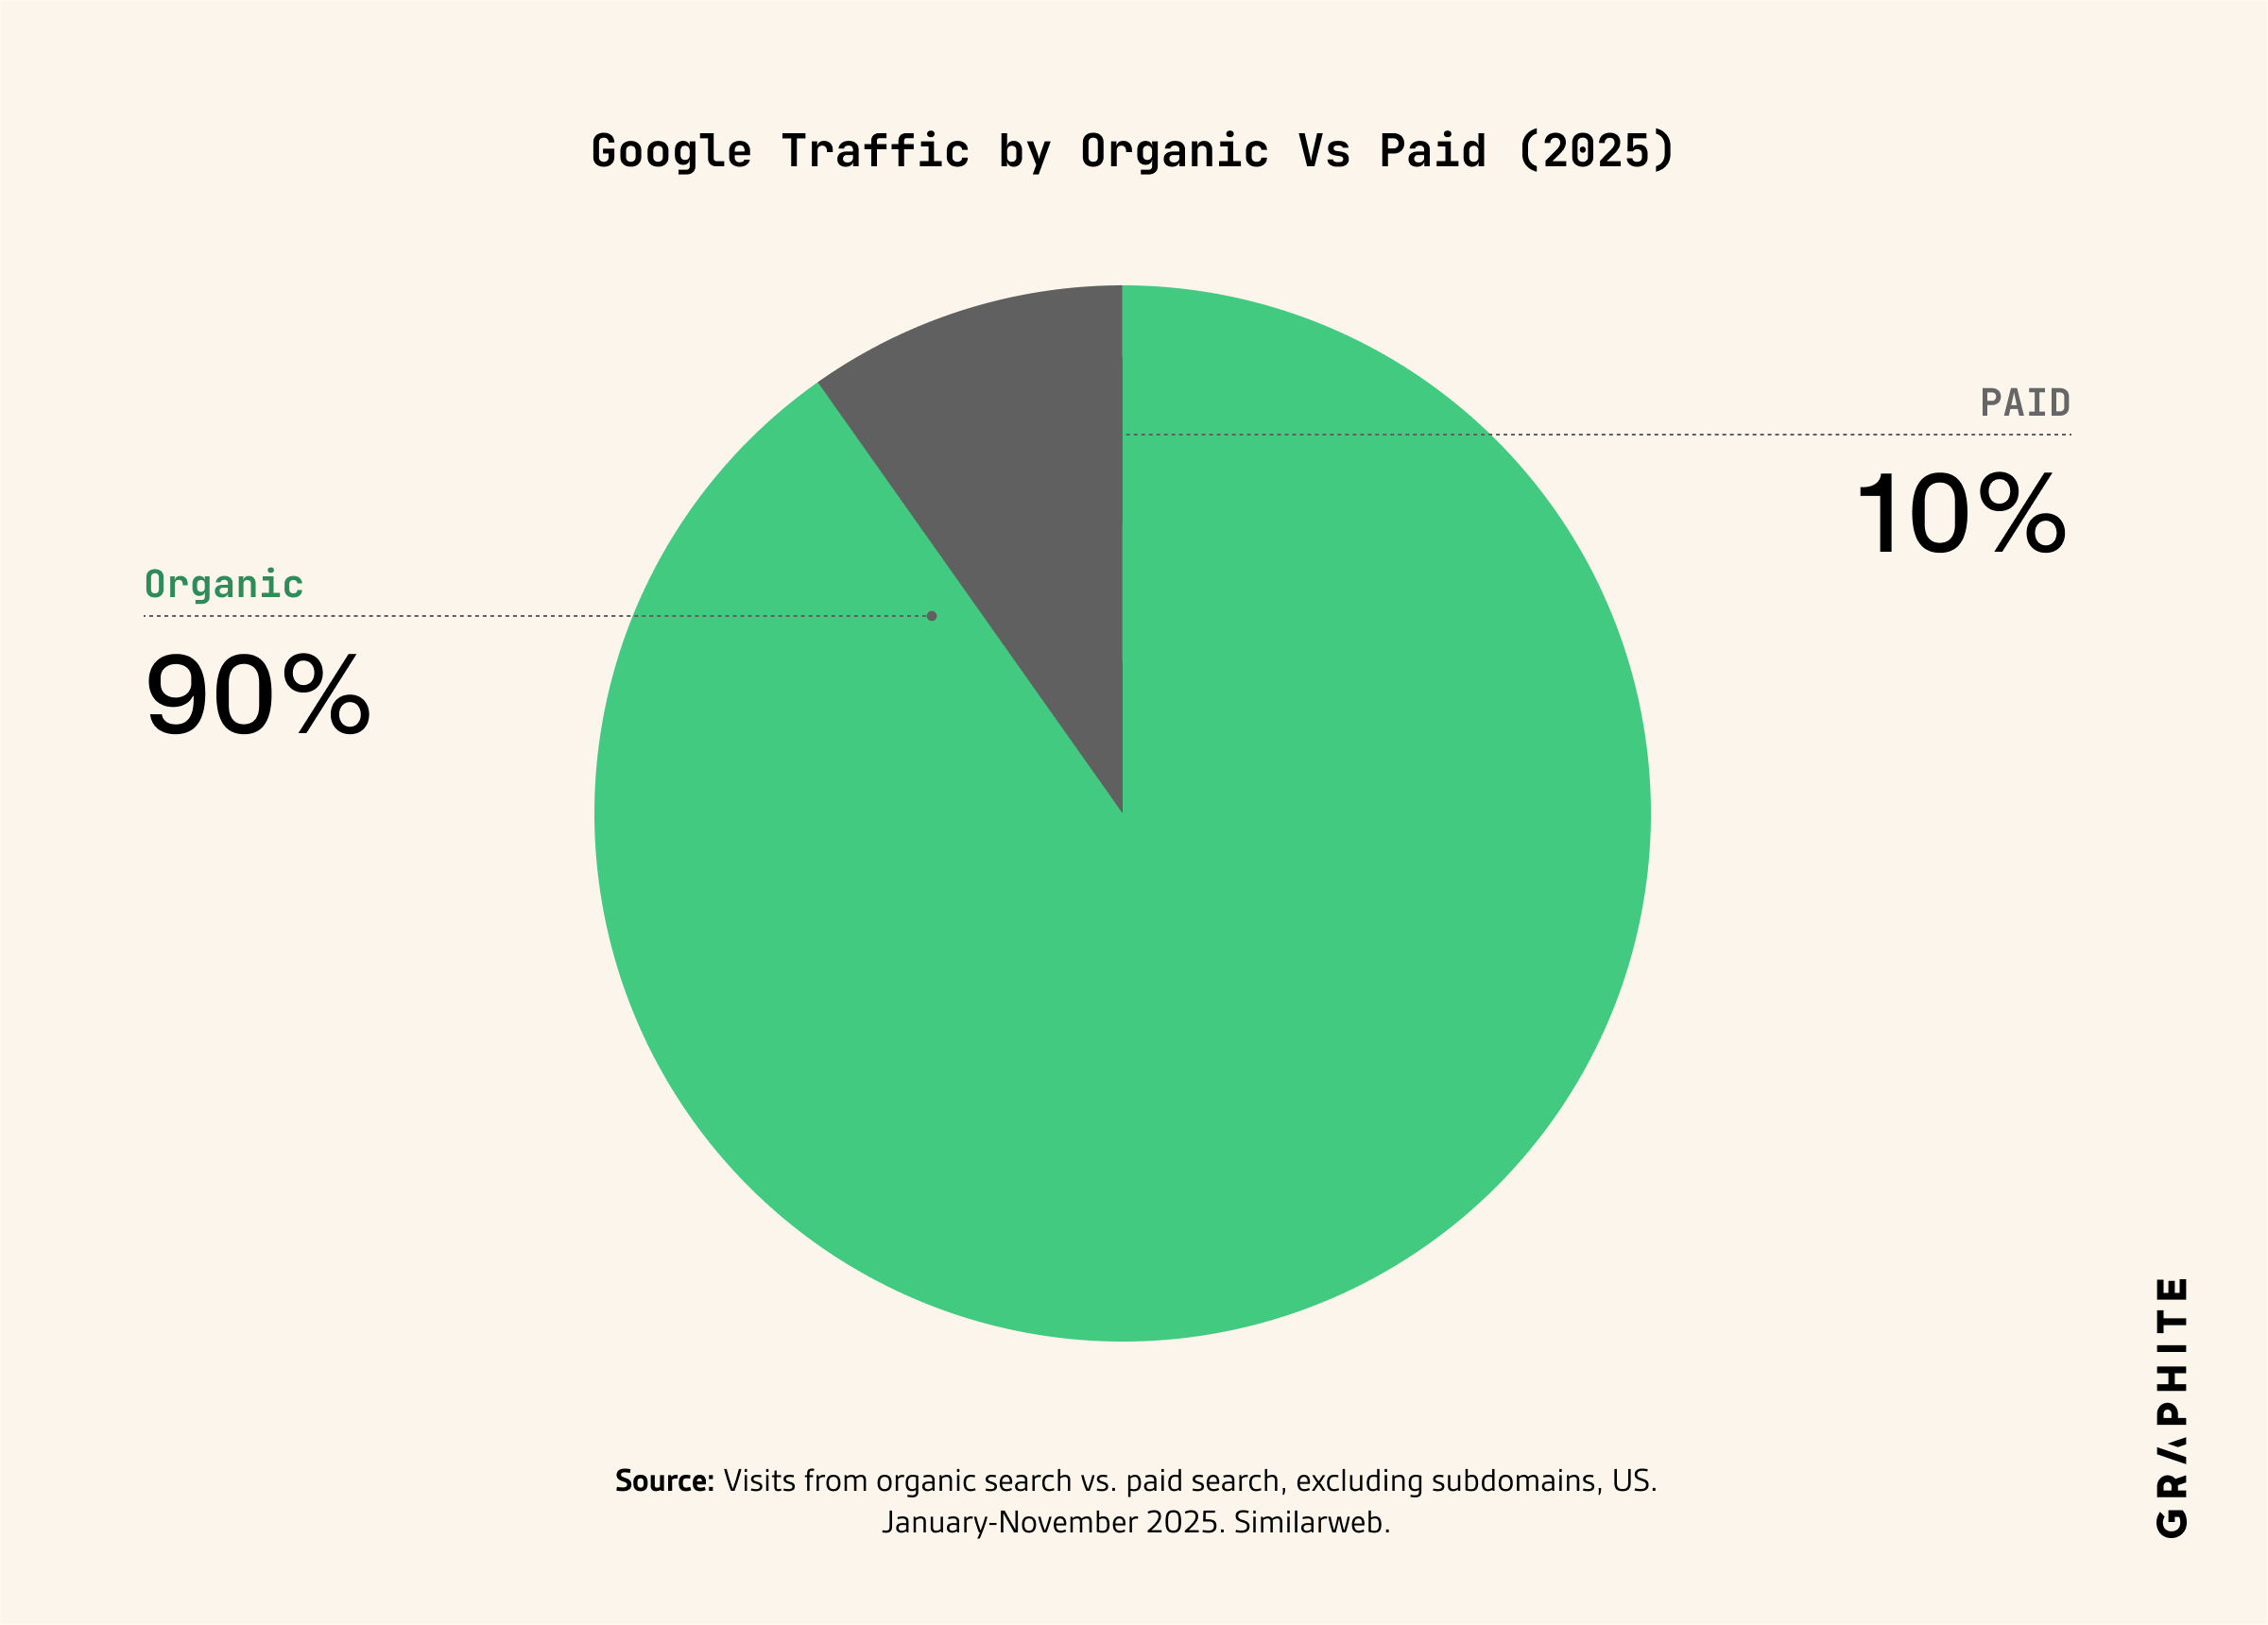
There is a small increase in clicks going to ads, but organic clicks are still 10x larger than clicks to ads.
The Myths
In this study, I seek to debunk the myths that SEO traffic has declined dramatically (25%+), including the following claims:
- SEO traffic has decreased by -25% and may soon decrease by -50%.
- The dramatic growth of LLMs has caused people to use LLMs instead of search. 60%+ of people now use LLMs instead of search, and visits to Google are rapidly declining.
- AI Overviews has caused a dramatic reduction in click-through rate, thus causing SEO traffic to decline dramatically.
- Further, Google is “stealing clicks” by shifting more and more clicks away from organic in favor of ads.
The Truth
Graphite partnered with Similarweb to analyze over 40k of the largest sites in the US to evaluate the trend in organic search traffic. We provide substantial evidence that the prevailing narrative that SEO traffic has dramatically declined is false.
- SEO traffic is down slightly (-2.5%), not dramatically.
- Traffic to search engines increased from 2019 to 2020 (+6.9%), decreased slightly in 2022 (-1.5%), and has been relatively flat since 2023 (-1.0%). In fact, traffic has increased slightly in 2025 to both Google (+0.8%) and search engines as a whole (+0.4%). Further, visitors to Google increased by +1.4% comparing Q4 2025 vs. 2024.
- AI Overviews does decrease (-35%) click-through rates to organic results when present. However, AI Overviews only appear roughly 30% of the time. In 80% of cases, prior to AI Overviews, Google showed Featured Snippets, which also reduced click-through rate.
- There is a small increase in clicks going to ads, but organic clicks are still 10x larger than clicks to ads.
Search Engine Traffic Is Down Slightly
The Myth: Organic traffic from Google to websites is down dramatically (between -25% to -60%).
The Truth: Organic traffic from Google to websites is down slightly (-2.5% YoY).
Data: US monthly visits from all search engines. We looked at the top 40,000 largest websites and compared 2/24-12/24 vs. 1/25 - 11/25 using visit data from Similarweb.
This is consistent with Google’s statement in August 2025 that, “Overall, total organic click volume from Google Search to websites has been relatively stable year-over-year.” (source)
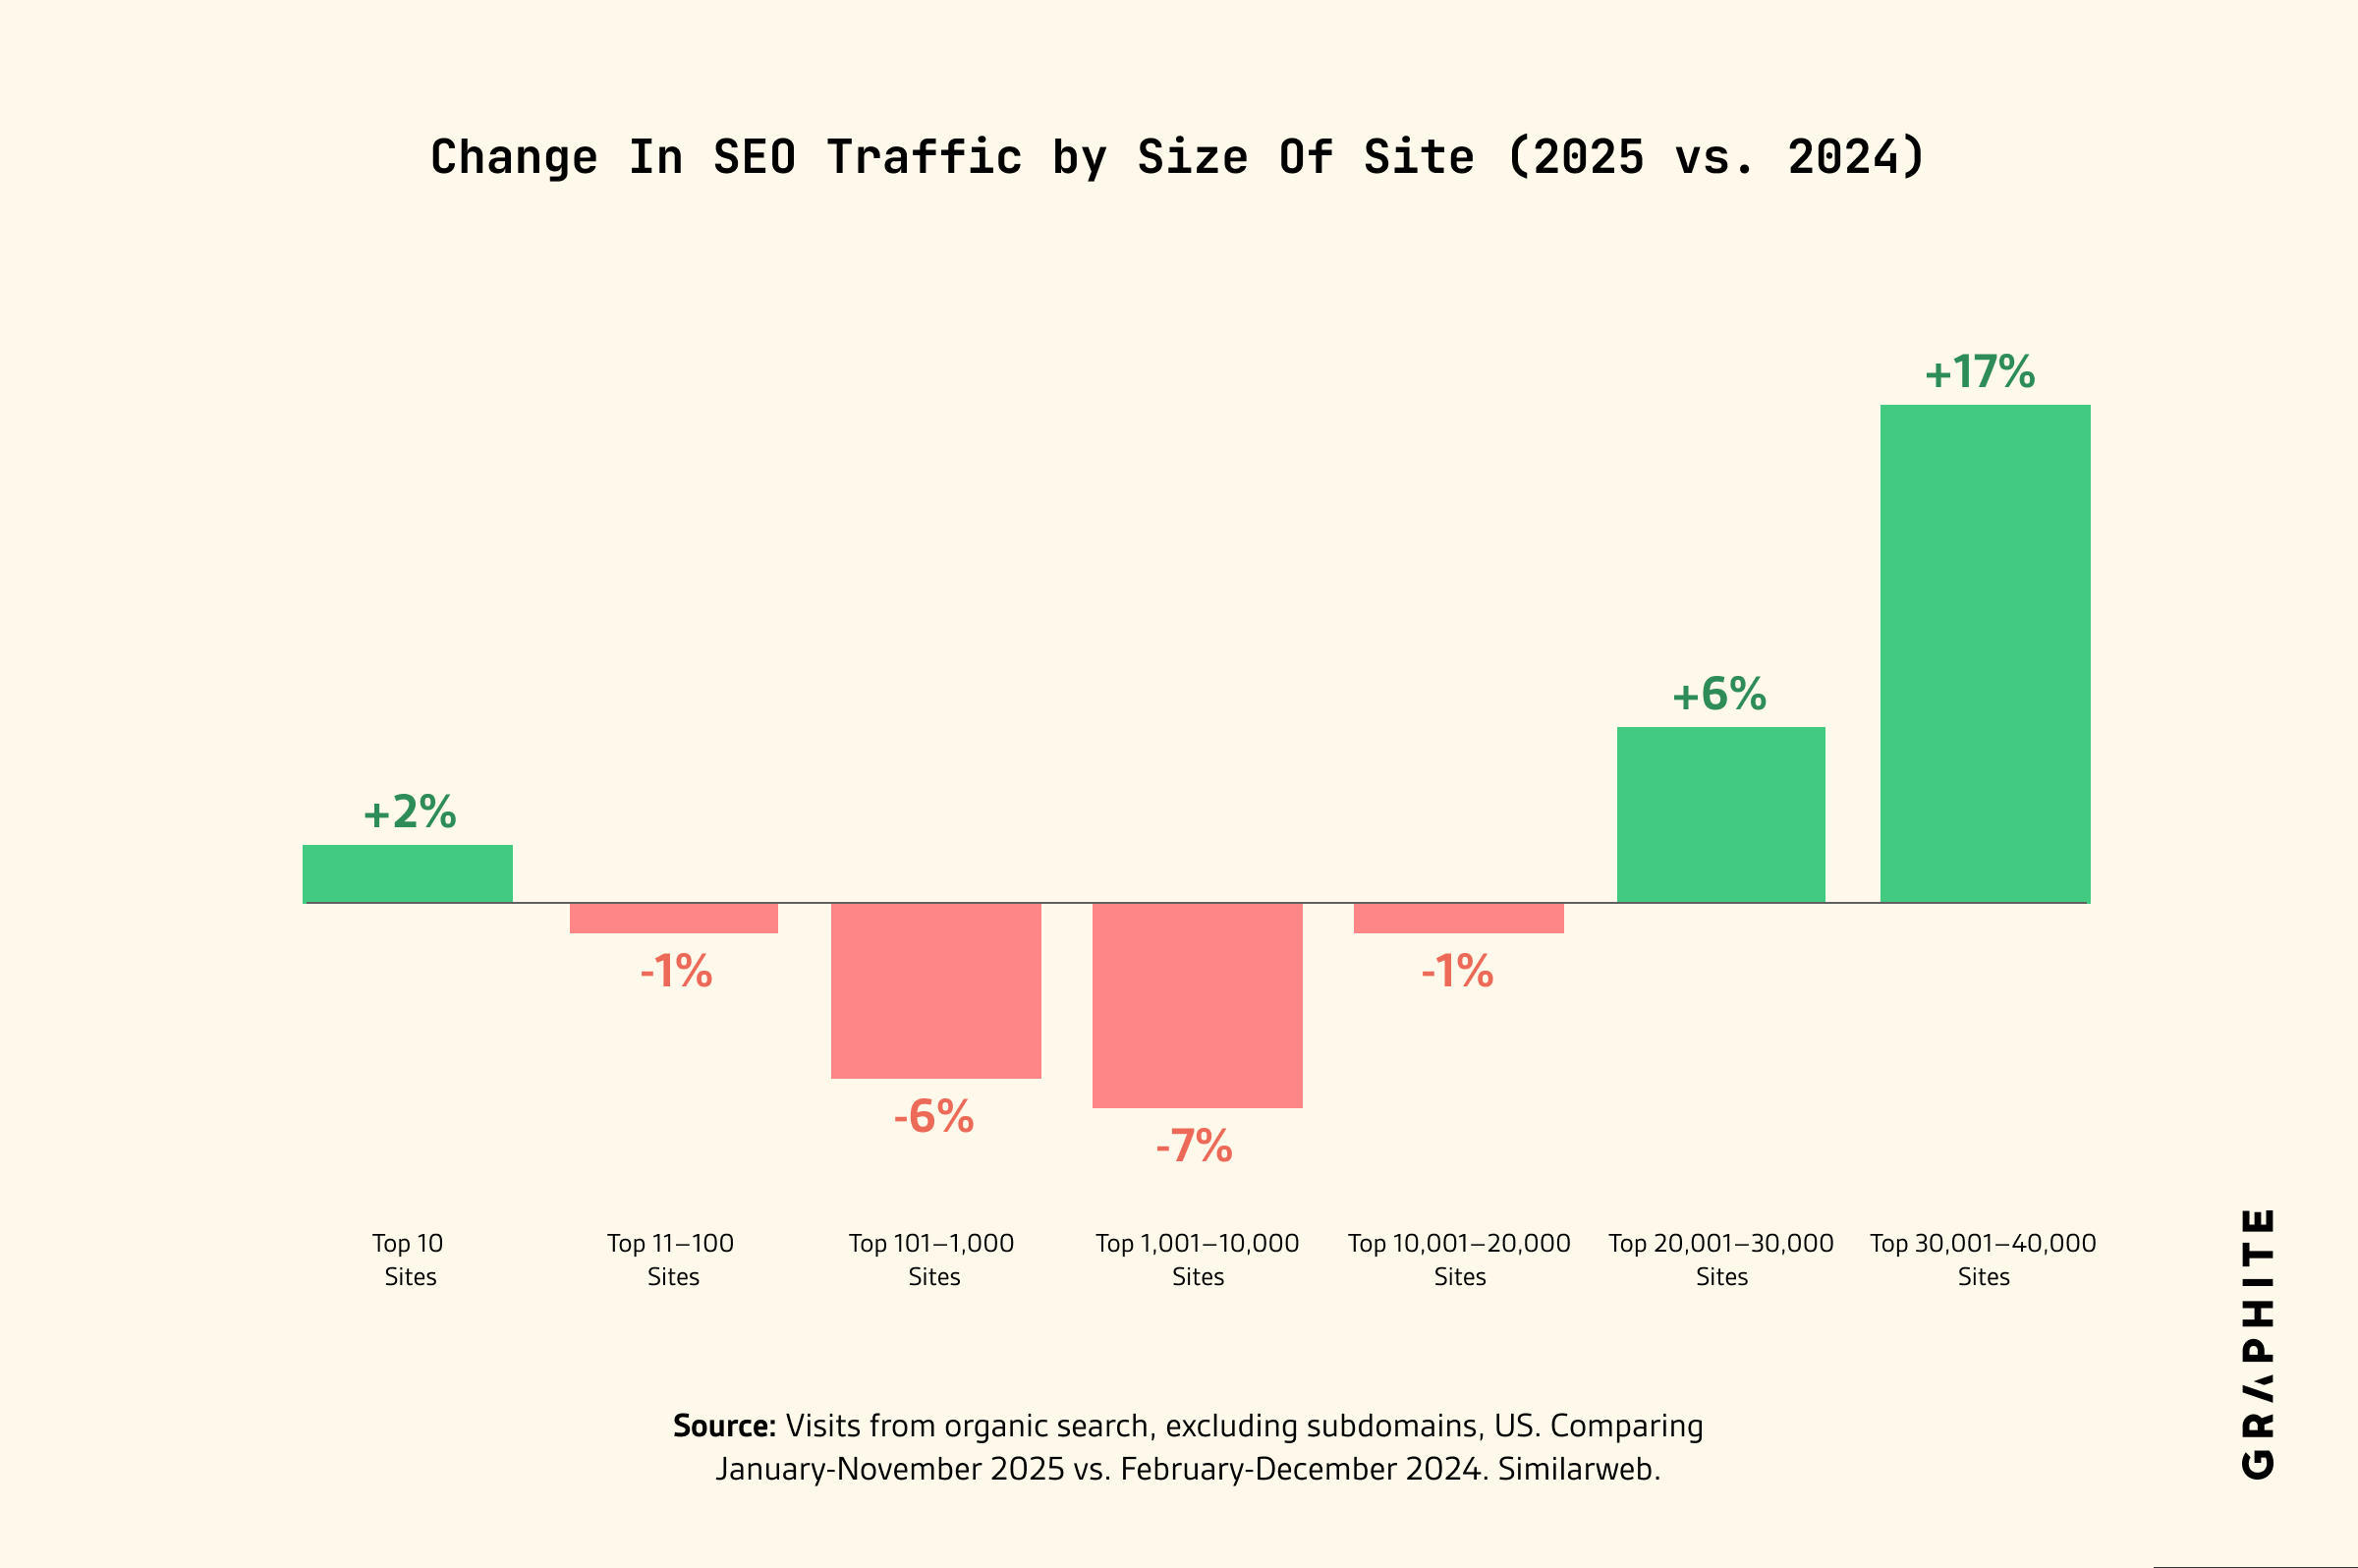
SEO Traffic Changed Based on the Size of the Site
We compared the traffic changes by the size of the top 40k sites. The 10 largest sites and many smaller sites also increased. The decrease in traffic was focused primarily on sites in the middle of the pack, namely the top 100-10,000 sites by size.
Top 10 Sites Change in SEO Traffic
| Website | 2025 vs. 2024 |
|---|---|
| reddit.com | +10% |
| youtube.com | +5% |
| wikipedia.org | -3% |
| amazon.com | -1% |
| facebook.com | +5% |
| fandom.com | +1% |
| quora.com | -45% |
| yahoo.com | -1% |
| instagram.com | +21% |
| ebay.com | +16% |
| average | +1.6% |
 amazon.com
 instagram.com
The Middle Sites Decreased the Most in SEO
| Largest Decreasing | 2025 vs. 2024 | Largest Increasing | 2025 vs. 2024 |
|---|---|---|---|
| digitaltrends.com | -68% | chatgpt.com | +213% |
| dailybot.com | -67% | newsbreak.com | +137% |
| byjus.com | -64% | quince.com | +132% |
| chegg.com | -60% | primevideo.com | +112% |
| lifewire.com | -60% | narvar.com | +111% |
| scroller.com | -56% | janitorai.com | +90% |
| study.com | -54% | whitehouse.gov | +89% |
| coursehero.com | -49% | temu.com | +71% |
| timeout.com | -48% | homes.com | +66% |
| thedirect.com | -48% | anthropologie.com | +66% |
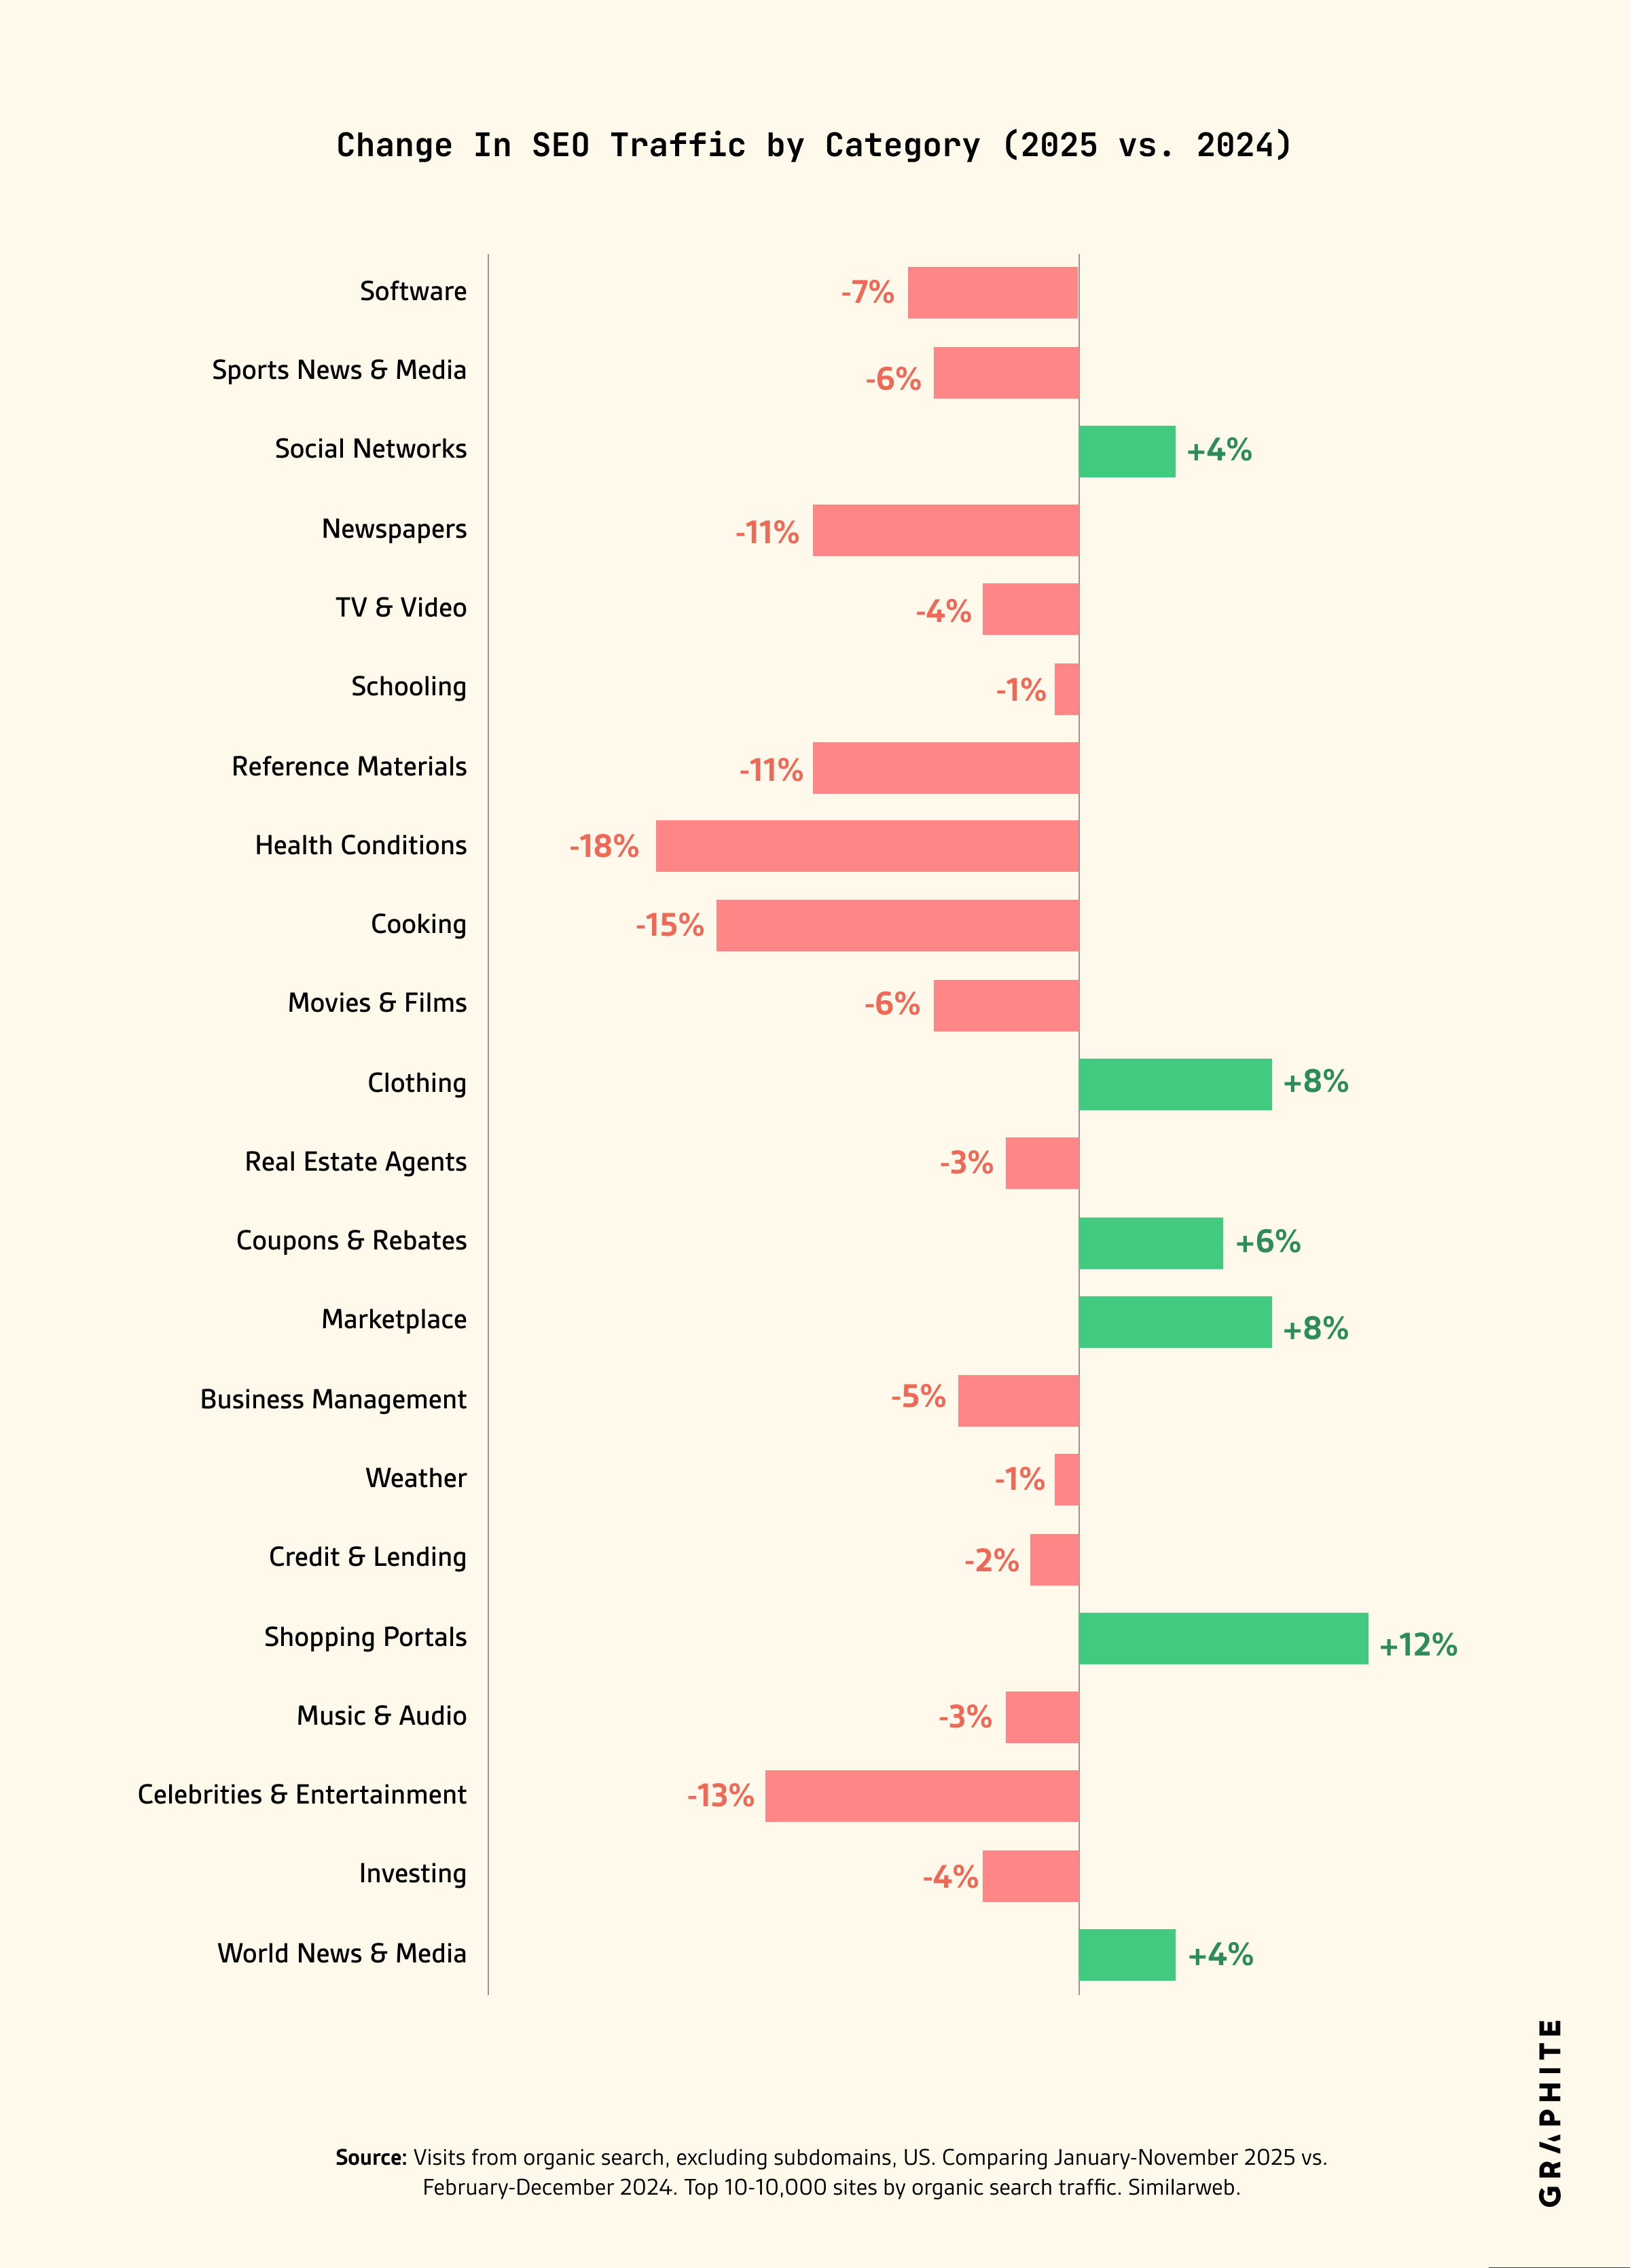
Some Categories Decreased, but Others Increased
News, health, cooking, and entertainment saw the largest drops, all decreasing by more than 10%. However, all other categories saw smaller decreases. Clothing, shopping, and marketplaces all saw increases.
Evaluation of Similarweb Data
Research Methods
If indeed SEO traffic has decreased by only -2.5%, why do so many other studies show substantially larger decreases of -25%, and overestimation by 1,000%? The answer lies with flawed methodologies such as surveys and small, biased samples (<20).
Surveys Are a Flawed Research Method for Traffic Trends
Quantitative studies are great for answering what and how many, but qualitative studies are best for answering why. Source
Multiple prominent research firms have published studies, all claiming dramatic decreases in search and proportionally dramatic increases in the adoption of LLMs.
While we see a traffic decline of -2.5%, they claim decreases of -25% and forecast future decreases of -50%.
These studies use the flawed research method of surveys.
Self-reported surveys have been used for decades as a legitimate research method in psychology, human-computer interaction, and market research. Academic researchers largely accept surveys as a research method to help explore questions about personal preferences and subjective experiences (e.g. what users do and don’t like about a mobile app) and future behavior (e.g. who will you vote for).
However, self-reported surveys are not always an appropriate research method. In particular, surveys are poor when used to answer questions such as past experiences, quantifying past behaviors, and objective behaviors. This is because human memory is often unreliable.
Let’s explore why self-reported surveys and human memory fail, and why surveys as a research method aren’t appropriate to evaluate whether SEO traffic has dramatically declined.
- Human Memory Is Generally Unreliable — When asked questions about past quantitative facts, such as the # of times a person did something, people often struggle to recall exact details and resort to inferences that use partial information from memory to construct a numeric answer. Source
- Frequency Illusion — The frequency illusion is a cognitive bias in which something you have just noticed or learned about suddenly seems to appear everywhere, not because it has become more common, but because your attention has shifted toward it. It stems from selective attention and confirmation bias.
- Selection / Survey Bias & Nonresponse — Who responds is often not representative; even high-quality surveys can be biased if the “missingness” is systematic. A survey about the adoption of LLMs may be biased towards early adopters who use LLMs more often than average. (source)
- Question Wording — Small details in wording can have large, unanticipated effects. For example, compare the wording of a question such as “Do you use ChatGPT to find products to buy?” vs. “Recall the last time you purchased a product. How did you find this product?” The former leads the participant to consider LLMs and asks a hypothetical question, while the latter asks about real past events and behaviors without suggesting an answer. It’s much better to ask what you did do rather than what you would do. Source
We do not include references to these studies in order to avoid criticizing specific individuals or companies, and instead focus on debating data and methodology.
Small Sample Sizes
A study looked at the declines in SEO traffic across 19 different sites. Some of the sites decreased while others actually increased in SEO traffic. A major media site then published a story with a headline about the 1 largest decreasing site.
The news of Hubspot and Monday.com decreasing in SEO traffic also made headlines.
In these cases, it is true that SEO traffic decreased. However, these are very small and biased samples.
Anecdotal Evidence and Personal Experience
I have heard from multiple people that they have heard anecdotal evidence that people are using LLMs instead of Google.
- “I stopped using Google and instead use ChatGPT/Perplexity/Gemini.”
- “I haven’t used Google in months and now exclusively use LLMs.”
- “I asked a classroom full of students, and over half said they no longer use Google and use LLMs instead.”
The reason why anecdotal evidence and personal experiences are misleading is similar to the shortcomings of surveys, except even more pronounced.
- Availability Heuristic — People estimate how common something is based on how easily examples come to mind. “I see lots of people using AI instead of Google. Therefore, the US population must be switching as well.”
- False Consensus Effect — People systematically overestimate how much others share their beliefs, behaviors, or preferences. “My tech and VC friends all use AI to search. Therefore, the US population must be switching as well.”
- Egocentric Bias — People overweight their own perspective when reasoning about others. “I use AI instead of search. Therefore, the US population must be switching as well.”
In most cases, people who claim they no longer use search and have switched completely to AI are misleading themselves.
Large Scale Panel Data Is the Most Appropriate Data Source
The best way to evaluate market trends is with large-scale quantitative first-party data.
For our study, we use data from Similarweb. Similarweb estimates website and app traffic by combining data from opt-in user panels, partnerships with ISPs and mobile carriers, publicly available web and app signals, and sites that choose to share direct measurement data. These inputs are blended and corrected using statistical models and machine-learning techniques to estimate visits, traffic sources, and engagement.
Similarweb draws on one of the largest commercially available digital behavior datasets, with data sourced from hundreds of millions of devices across desktop and mobile and coverage spanning billions of websites and apps globally. This gives it broad geographic and cross-platform visibility, especially useful for comparing large sites and market-level trends.
We independently evaluated the accuracy of Similarweb’s trend data.
First Party Data Correlation Analysis
We calculated the Pearson product-moment correlation coefficient of monthly click data in Google Search Console or Google Analytics vs. monthly session data from Similarweb for all search engines between September 2024 and November 2025. Similarweb data included all search engines, such as Bing and Yahoo while Google Search Console data includes only Google. We compare both US data and worldwide data.
Overall, in all but one case, the data had a high correlation. In most cases, the correlation was very high (>0.5). The median correlation was 0.86, which is considered very high.
Note: Pearson product-moment correlations are often confused with r² (coefficient of determination) correlations, which have higher thresholds of what is considered a strong correlation. Source
Similarweb vs. Google Search Console Pearson Product-Moment Correlation
| Worldwide | US | |
|---|---|---|
| Site 1 | 0.66 | 0.63 |
| Site 2 | 0.82 | 0.92 |
| Site 3 | 0.99 | 1.00 |
| Site 4 | 0.84 | 0.90 |
| Site 5 | 0.89 | 0.69 |
| Site 6 | 0.91 | 0.88 |
| Site 7 | 0.58 | 0.46 |
| Site 8 | 0.47 | 0.90 |
| Median | 0.83 | 0.89 |
Company Data Disclosures
In March 2025, Google publicly announced that as of January 2025, “We already see more than 5 trillion searches on Google annually.”
Data from Similarweb between January and December of 2024 show a total of 852.3B visits, 6.7 pages/visit, which sum to 5.7 trillion annual pageviews. This is consistent with Google’s announcement of “more than 5 trillion searches.”
Correction for Leap Year
2024 had an extra day due to Leap Year. We adjusted 2024 numbers to correct for this difference.
People Still Use Search Most of the Time
The Myth: People are using search less and are using LLMs as a replacement for search.
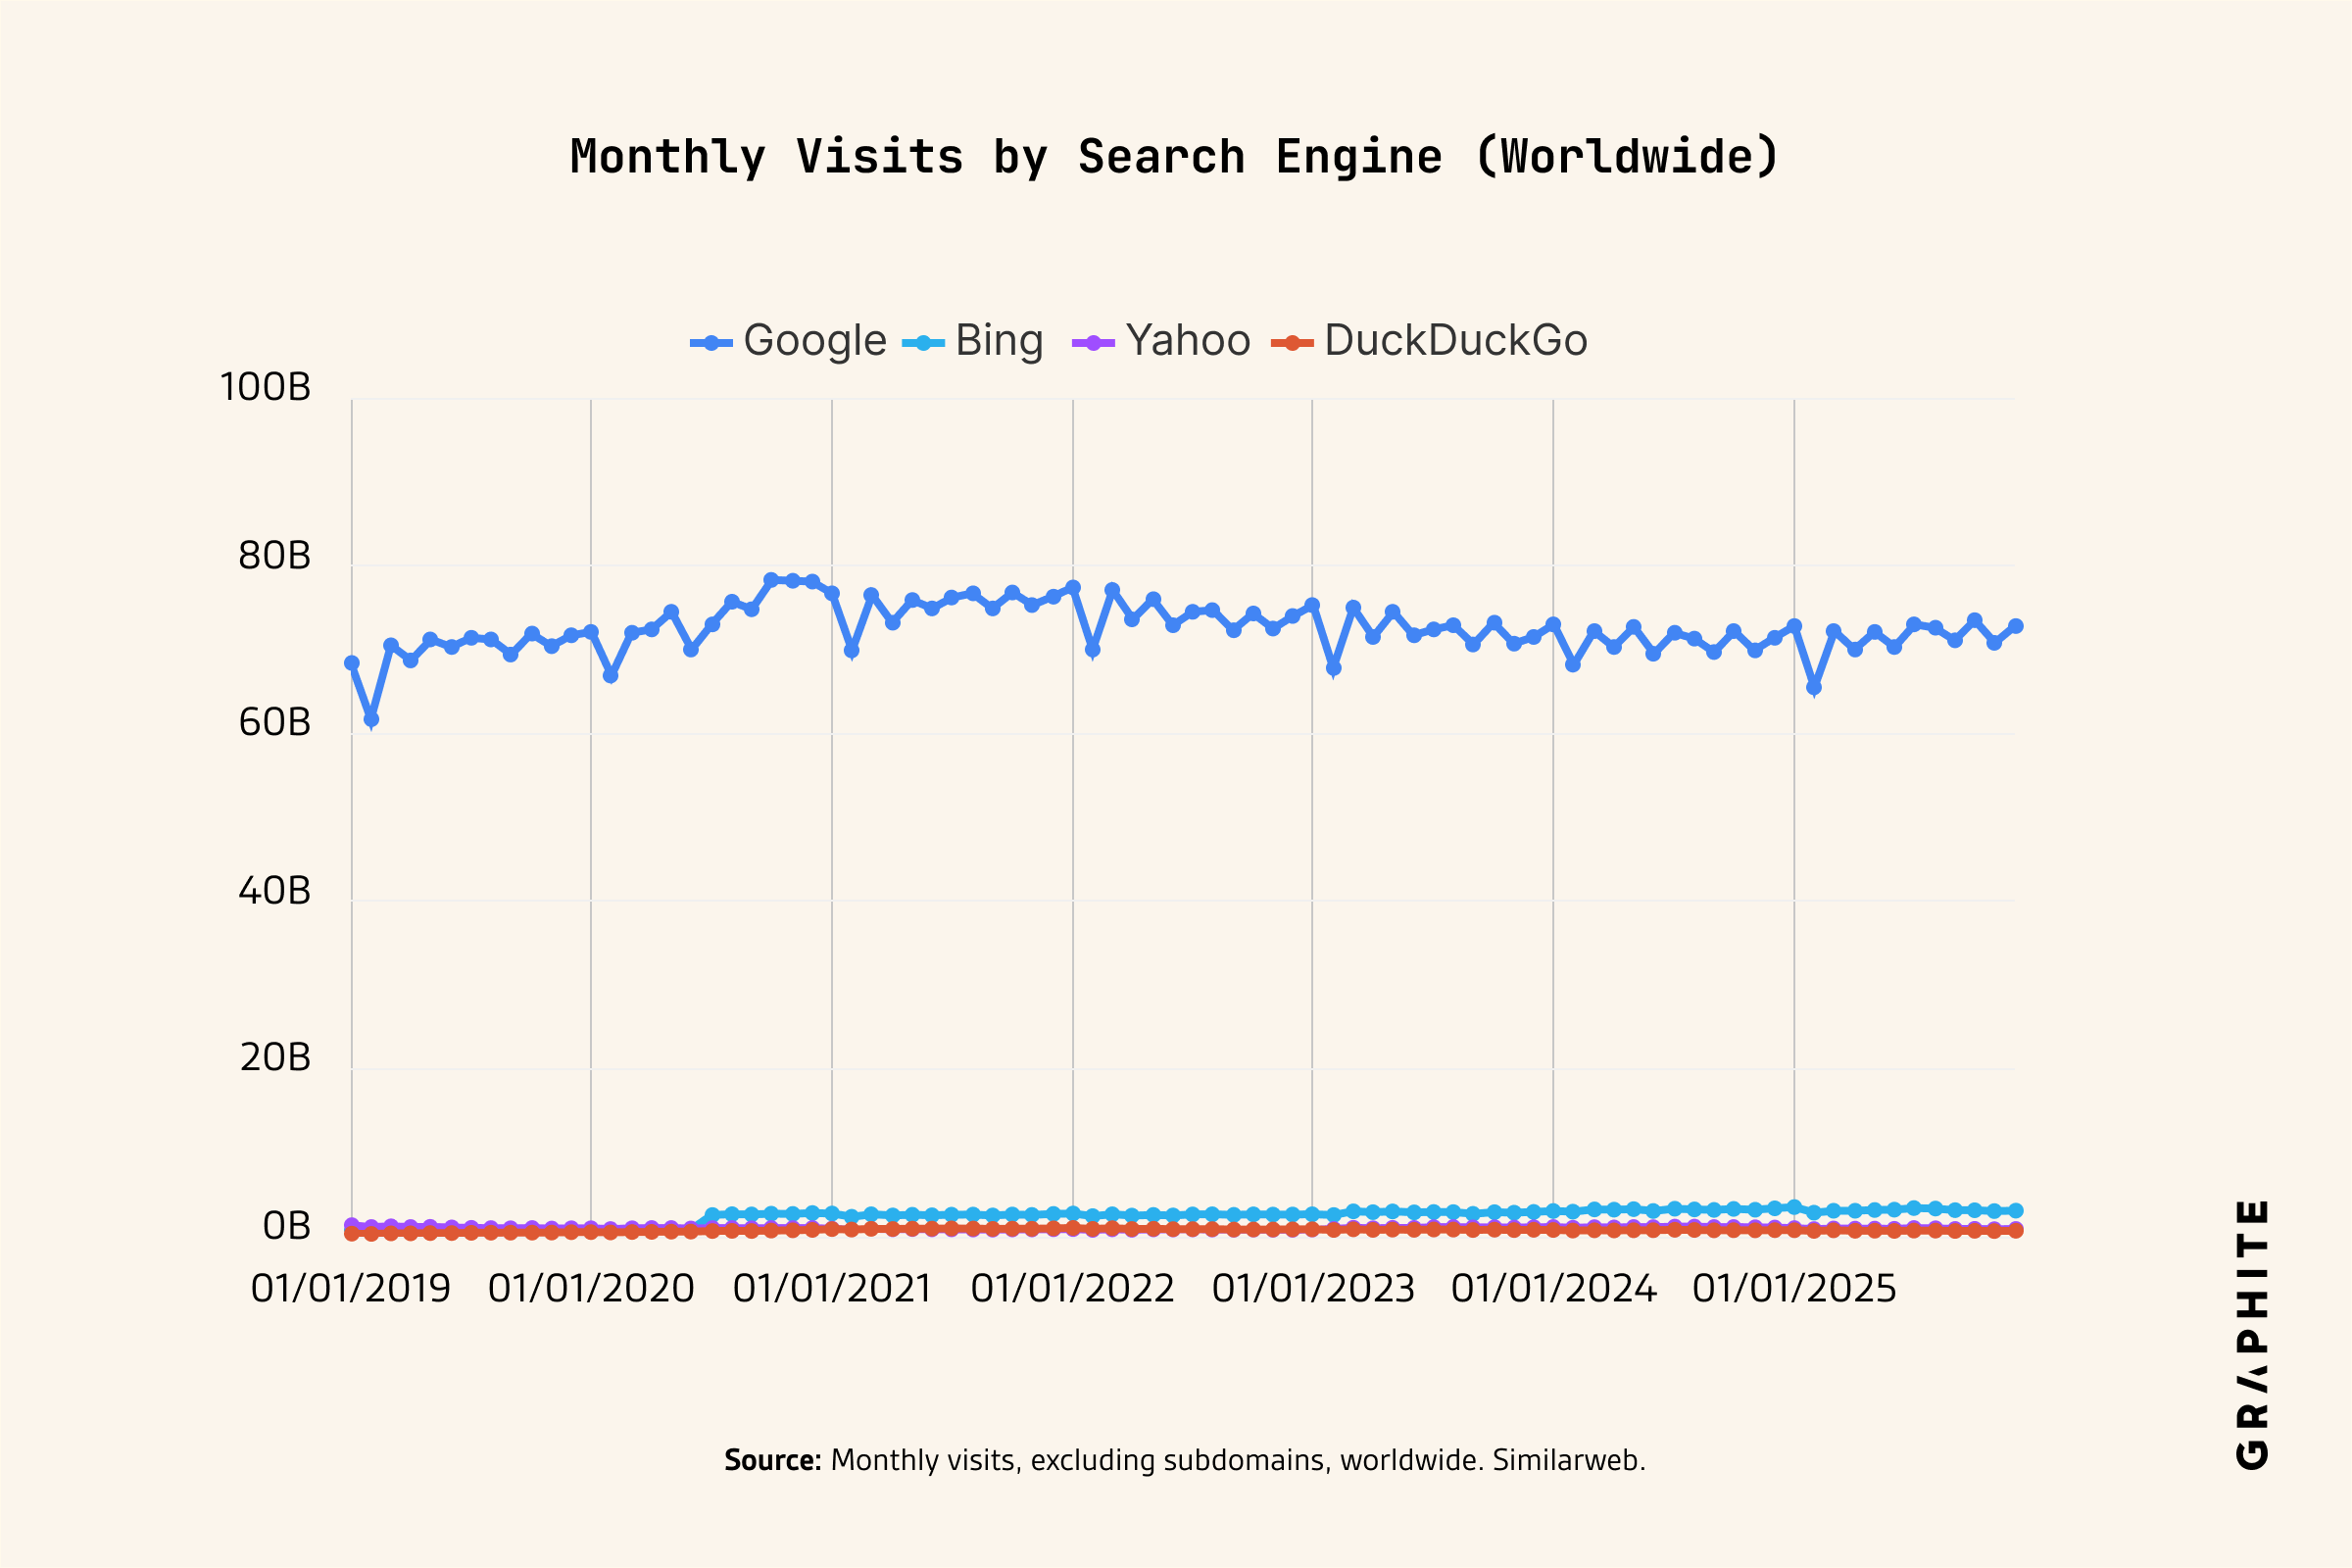
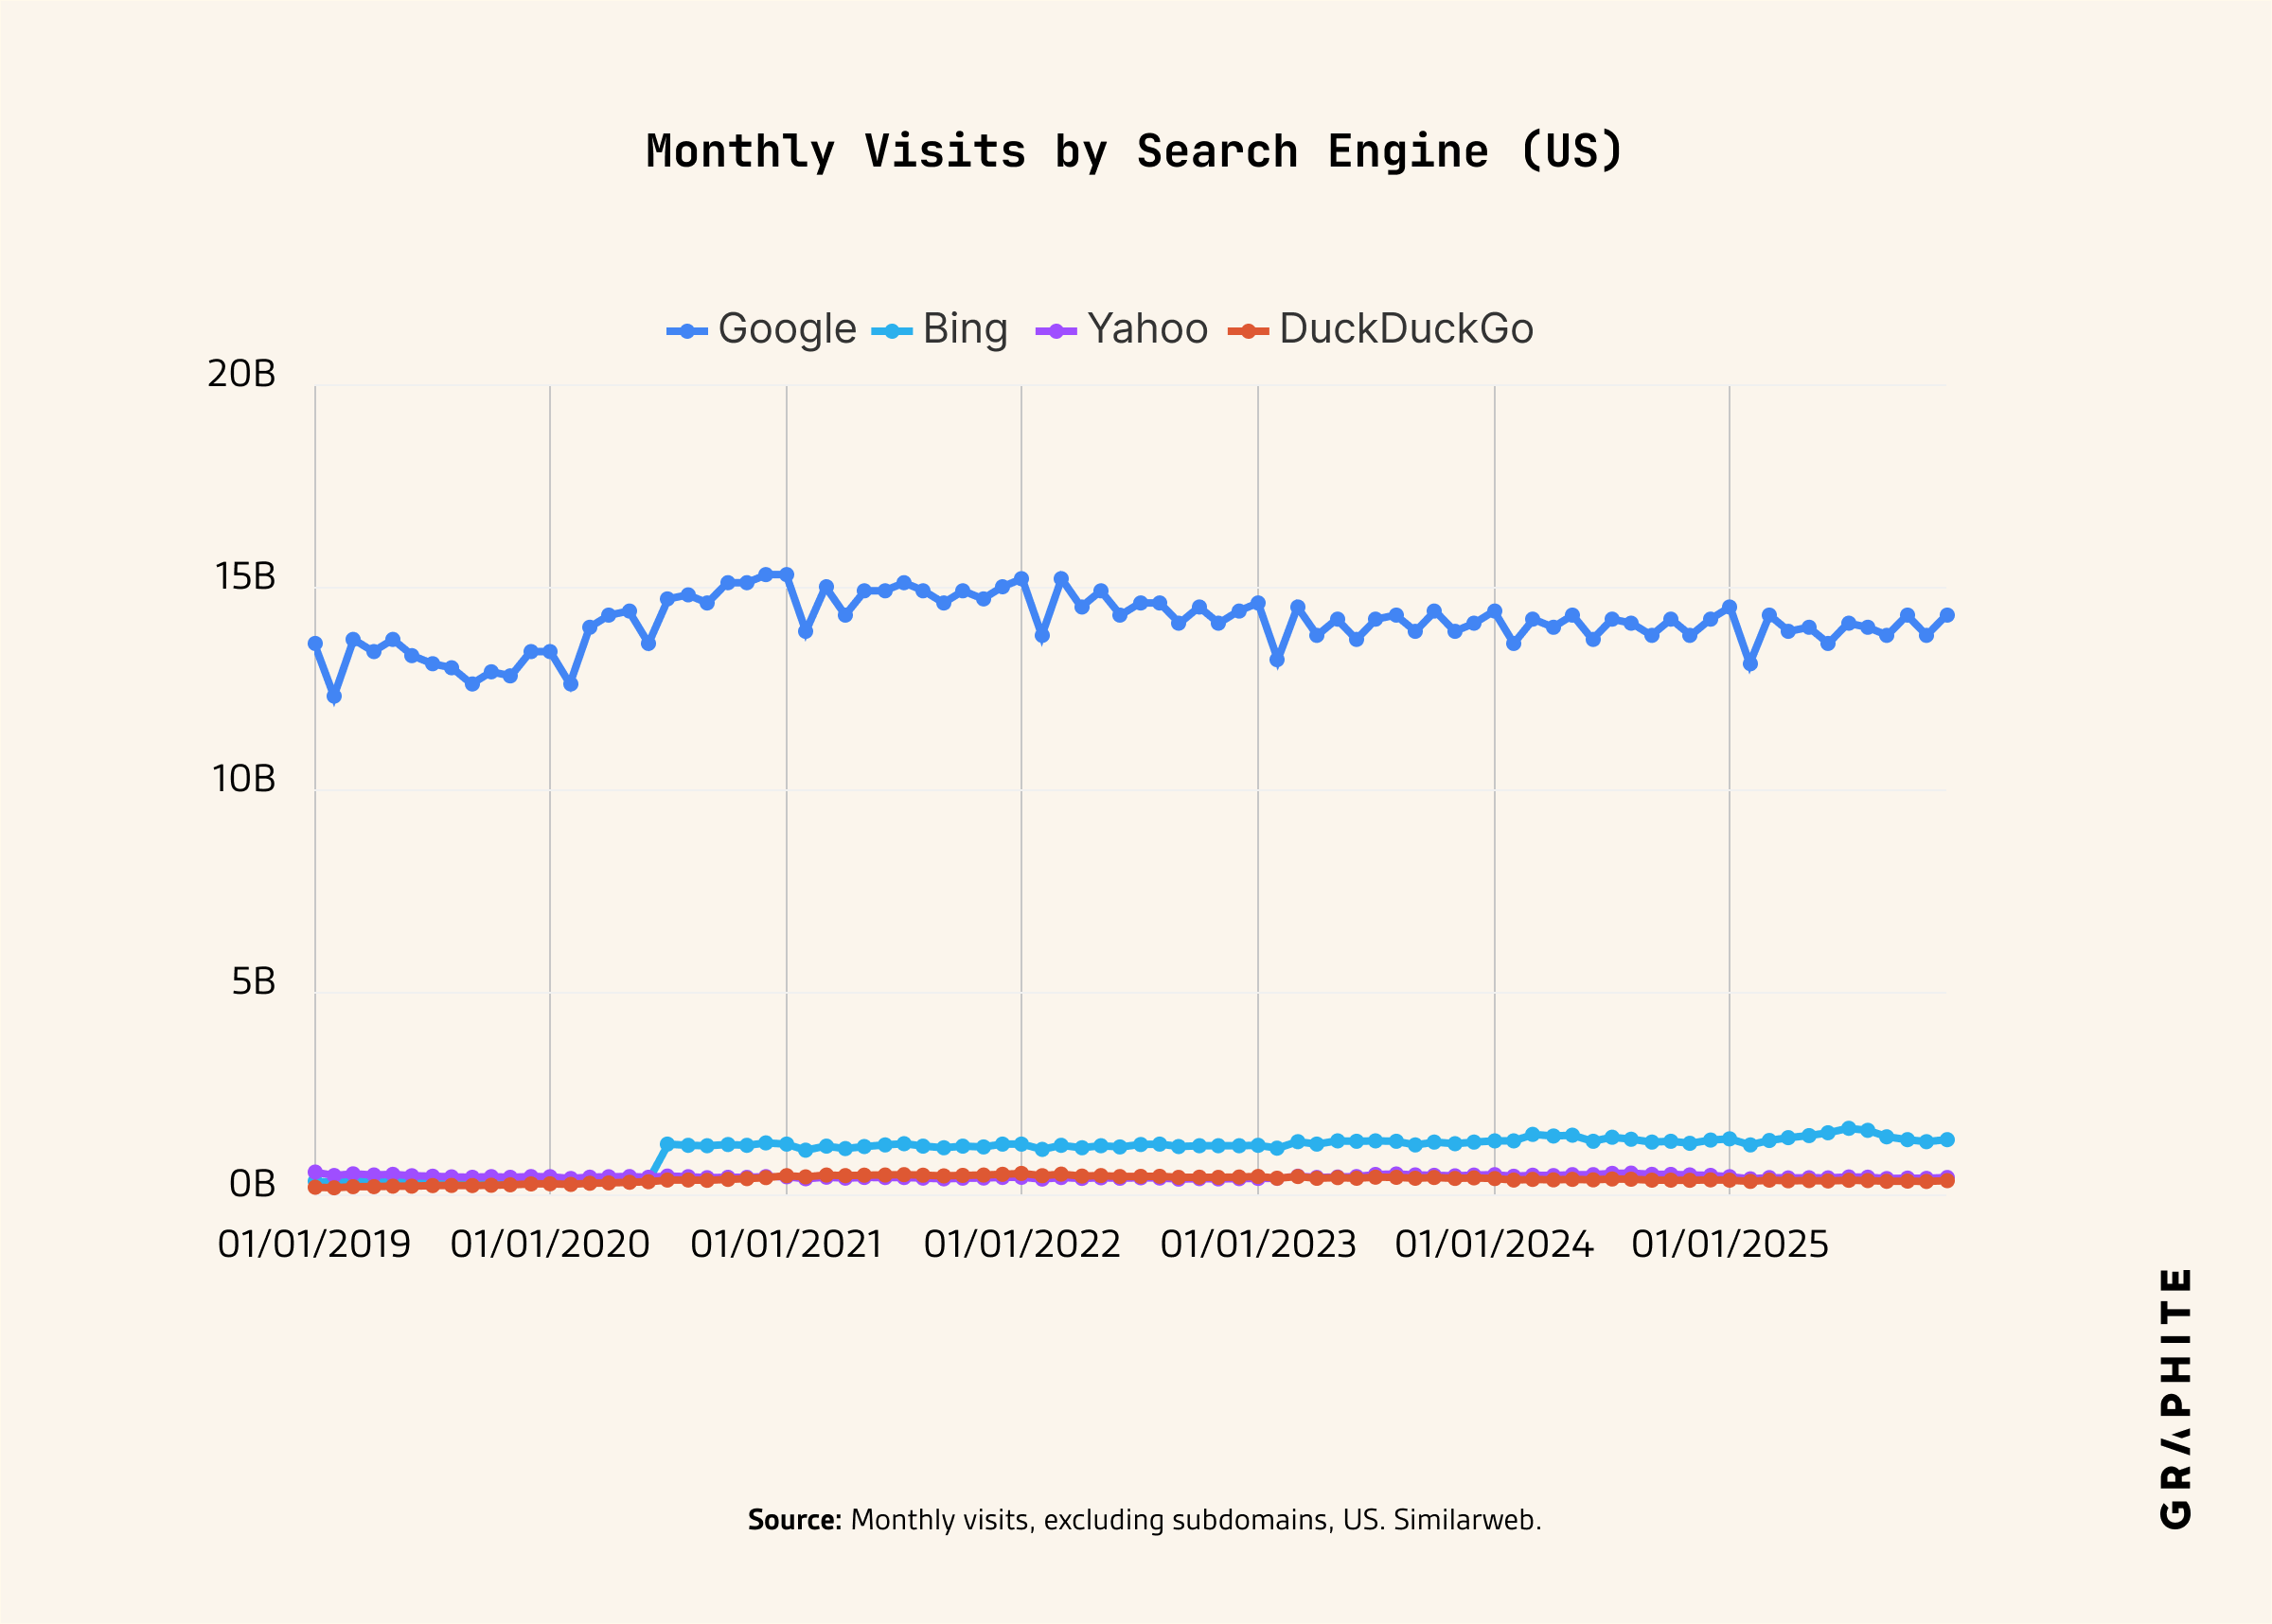
The Truth: Traffic to search engines increased from 2019 to 2020 (+6.9%), decreased slightly in 2022 (-1.5%), and has been relatively flat since 2023 (-1.0%). In fact, traffic has increased slightly in 2025 to both Google (+0.8%) and search engines as a whole (+0.4%).
Traffic to Search Engines
| 2025 vs. 2024 | 2025 vs. 2023 | 2025 vs. 2019 | |
|---|---|---|---|
| Google (US) | -0.2% | -0.7% | +6.3% |
| Google (Worldwide) | +0.8% | -1.2% | +2.4% |
| Top 4 Search Engines (US) | -0.5% | -0.4% | +6.3% |
| Top 4 Search Engines (Worldwide) | +0.4% | -1% | +5.8% |
Visits to Search Engines Increased in 2025 (+0.4%)
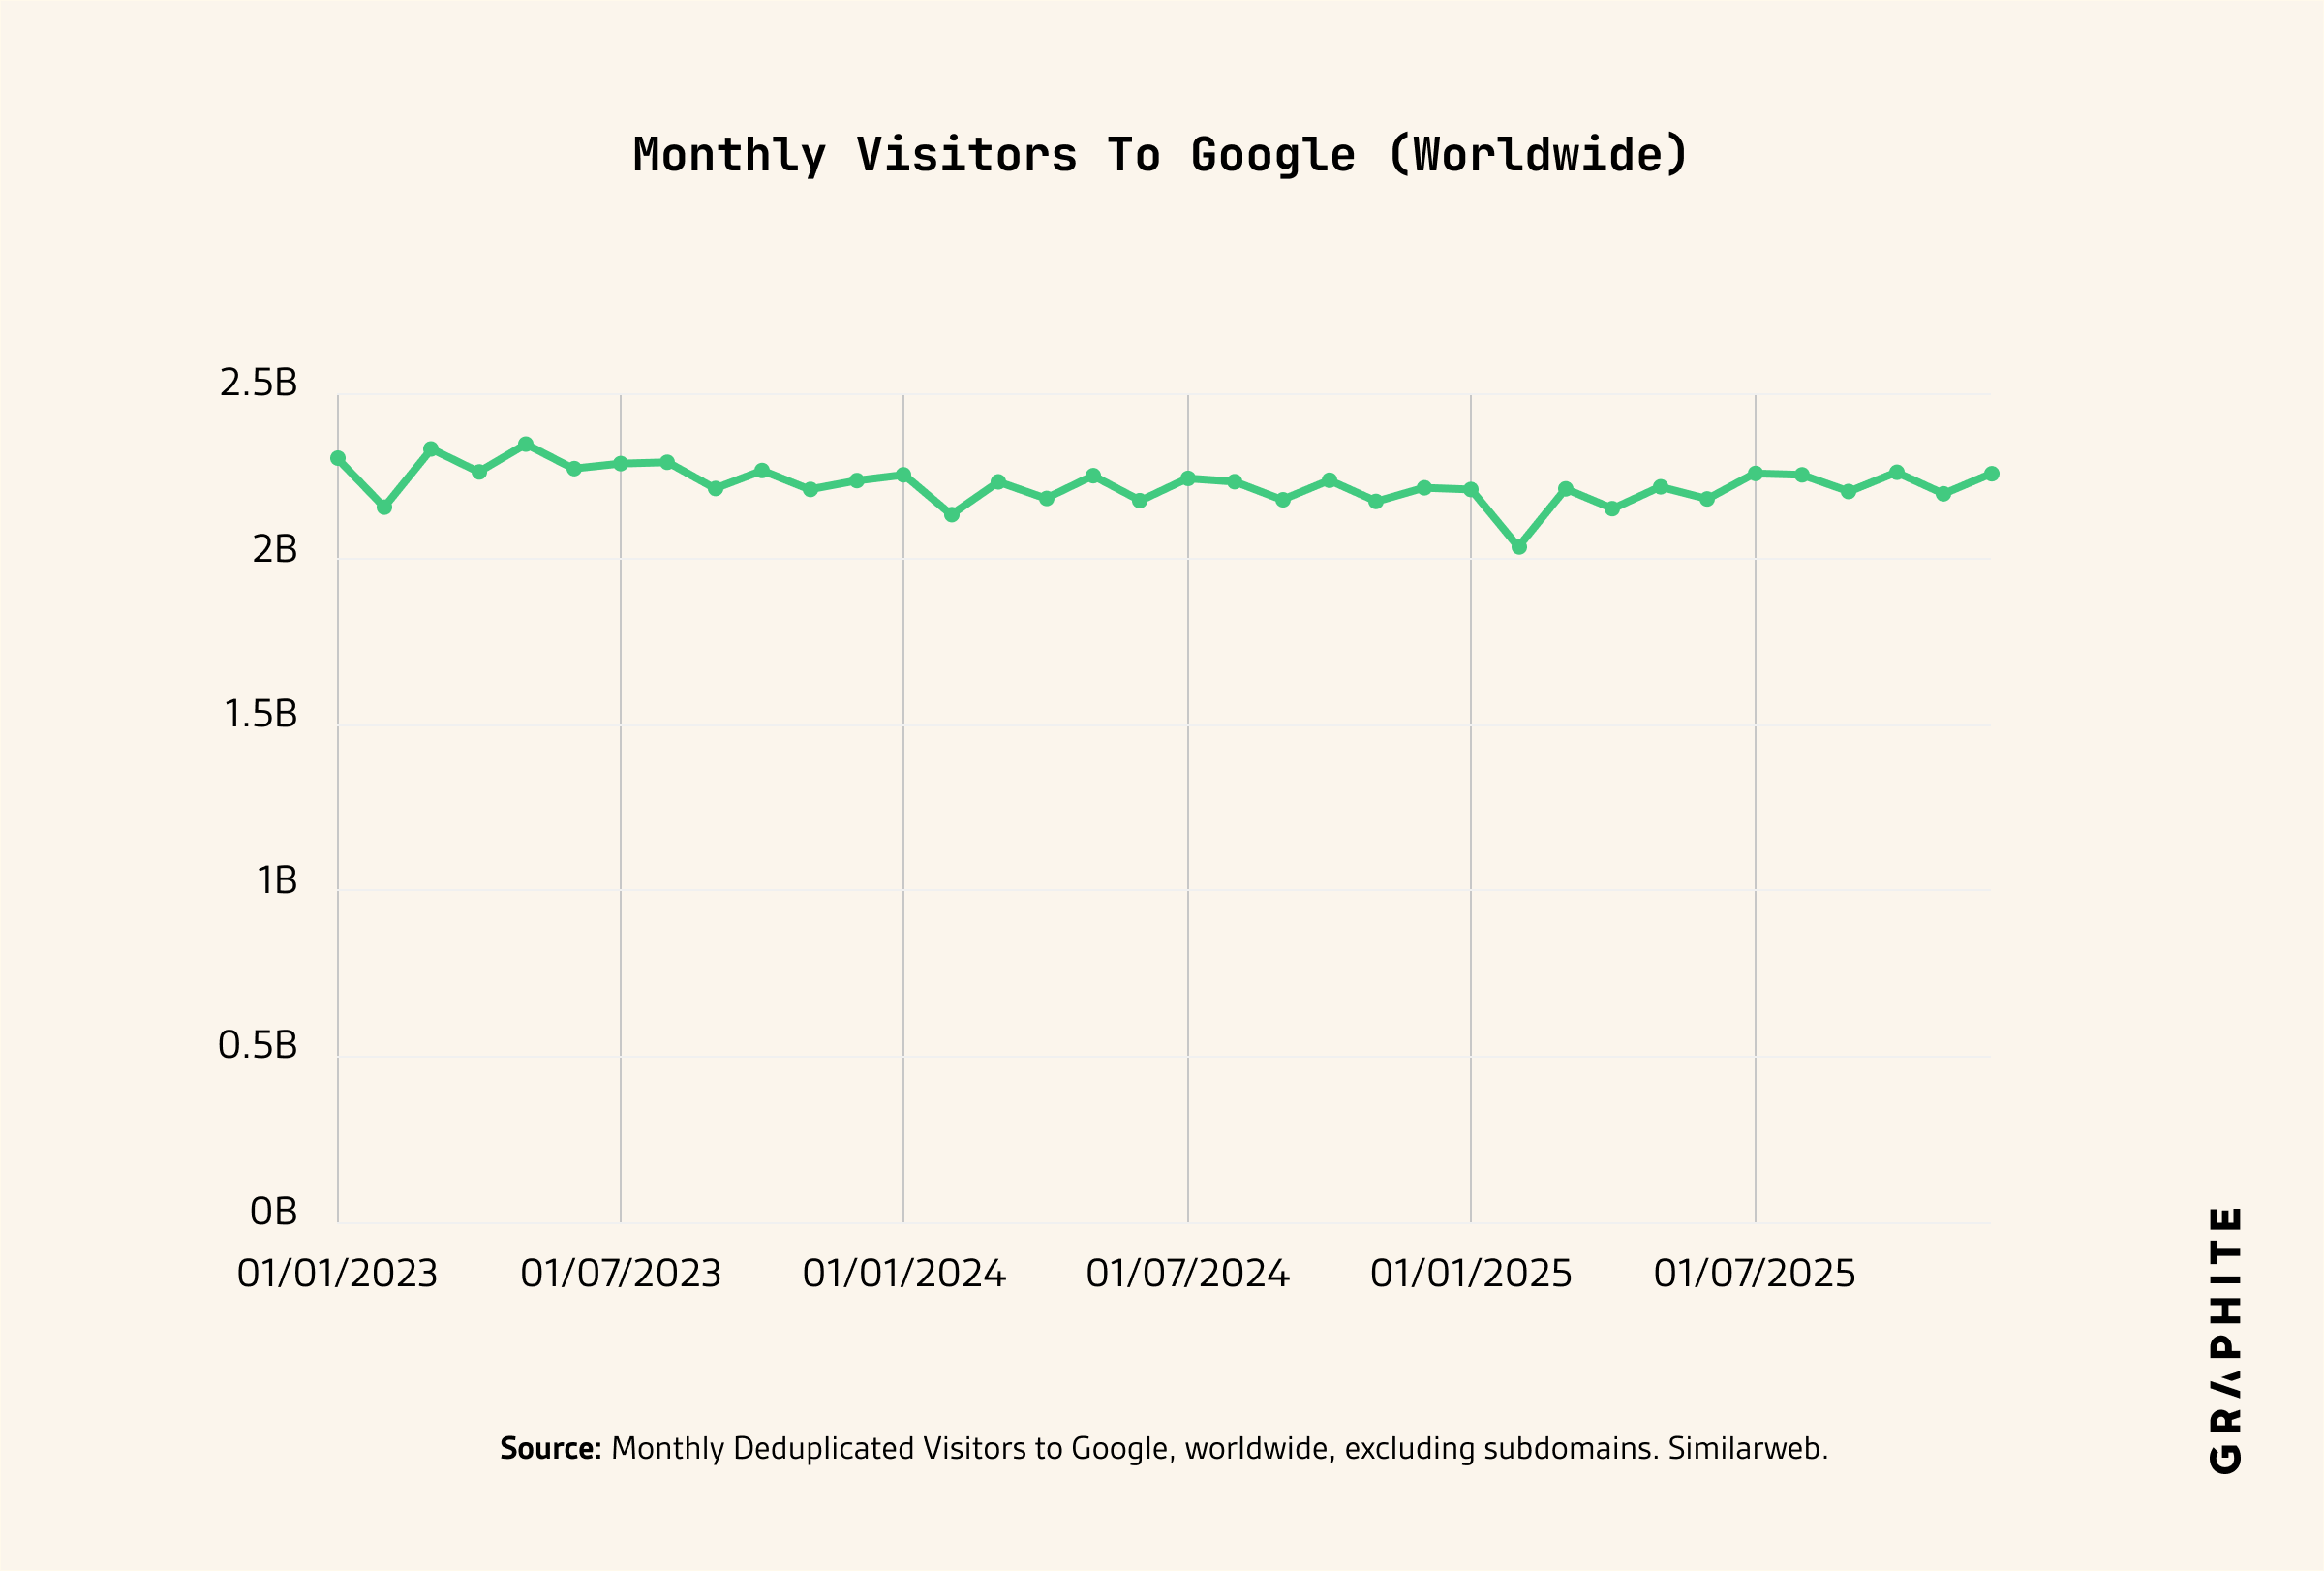
Visitors to Google Decreased in 2024, but Stayed Flat in 2025
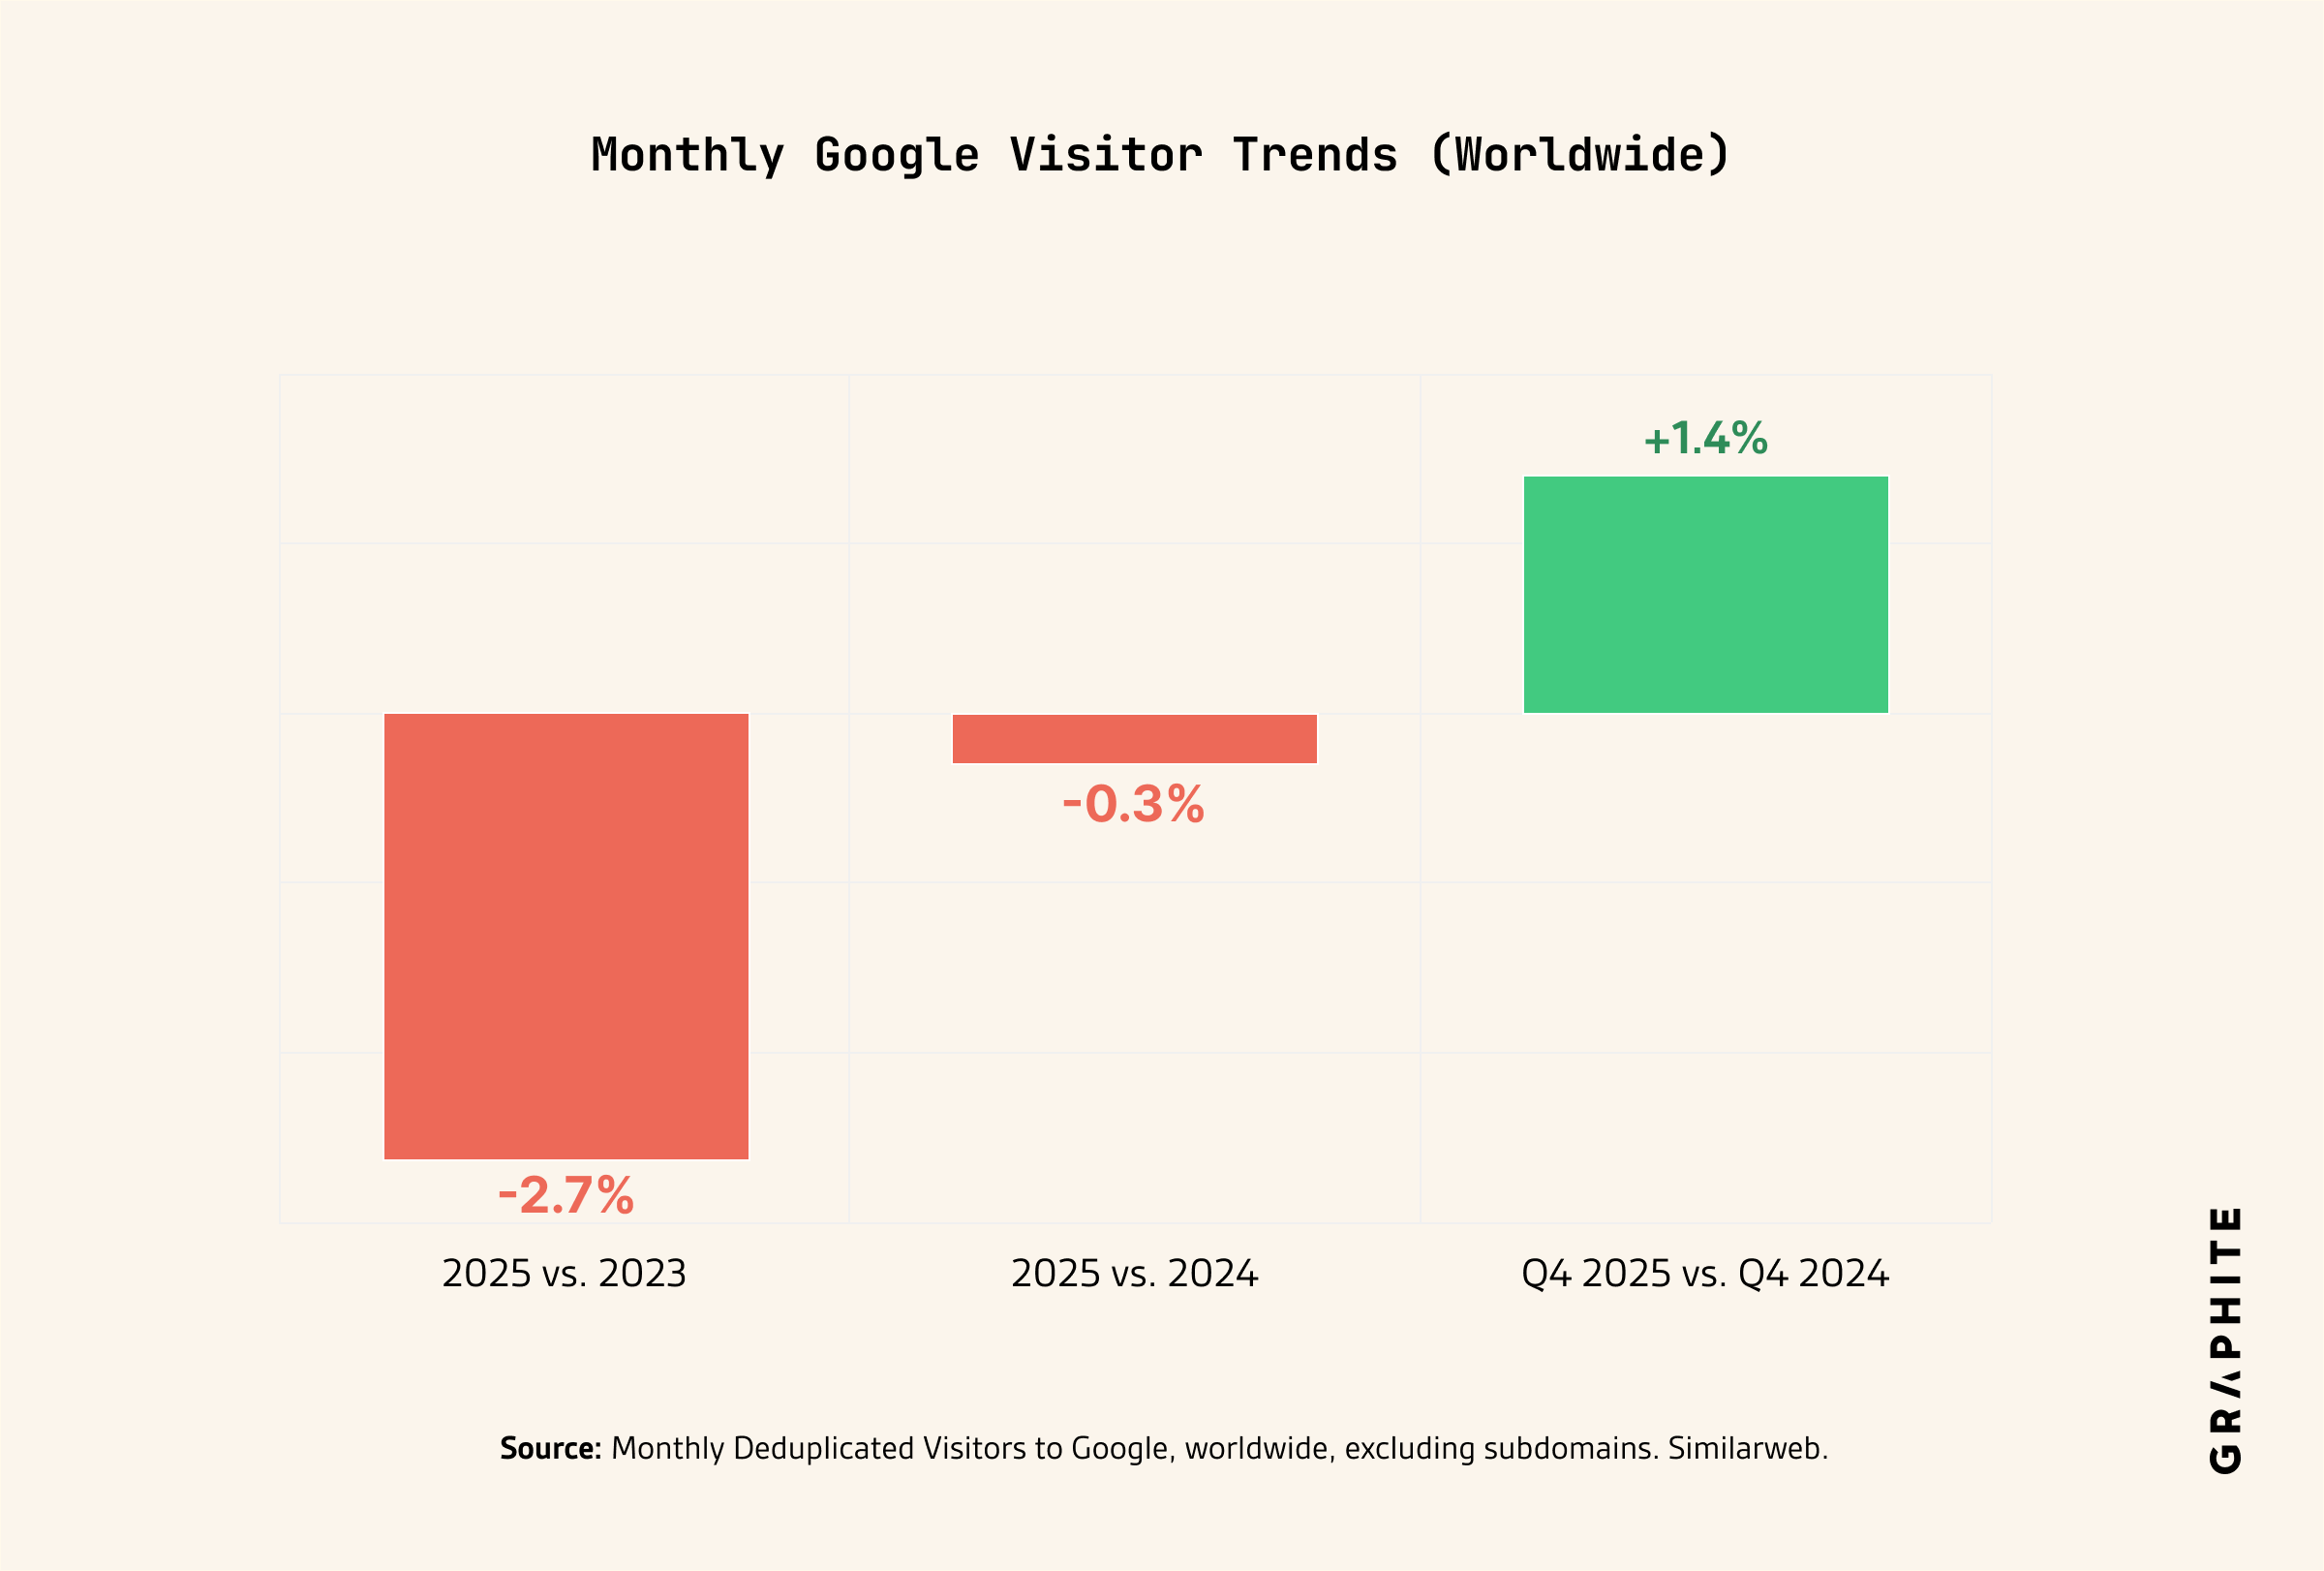
There has been almost no change (-0.3%) in the number of visitors to Google Search comparing 2025 vs. 2024. There was, however, a decrease in 2024 vs. 2023 of roughly -2.7%. This decrease did not continue in 2025.
In fact, visitors to Google grew by +1.35% in both the US and worldwide, comparing Q4 of 2025 vs. 2024.
Note: We use deduplicated visitors, which controls for people using multiple devices, such as mobile vs. desktop.
Visitors to Google
| Q4 2025 vs. Q4 2024 | 2025 vs. 2024 | 2025 vs. 2023 | |
|---|---|---|---|
| Google (US) | +1.5% | -0.2% | -2.5% |
| Google (Worldwide) | +1.5% | -0.3% | -2.7% |
Google Is Not “Stealing” More Clicks With Ads
The Myth: Google is increasingly pushing users to click on ads more and organic results less.
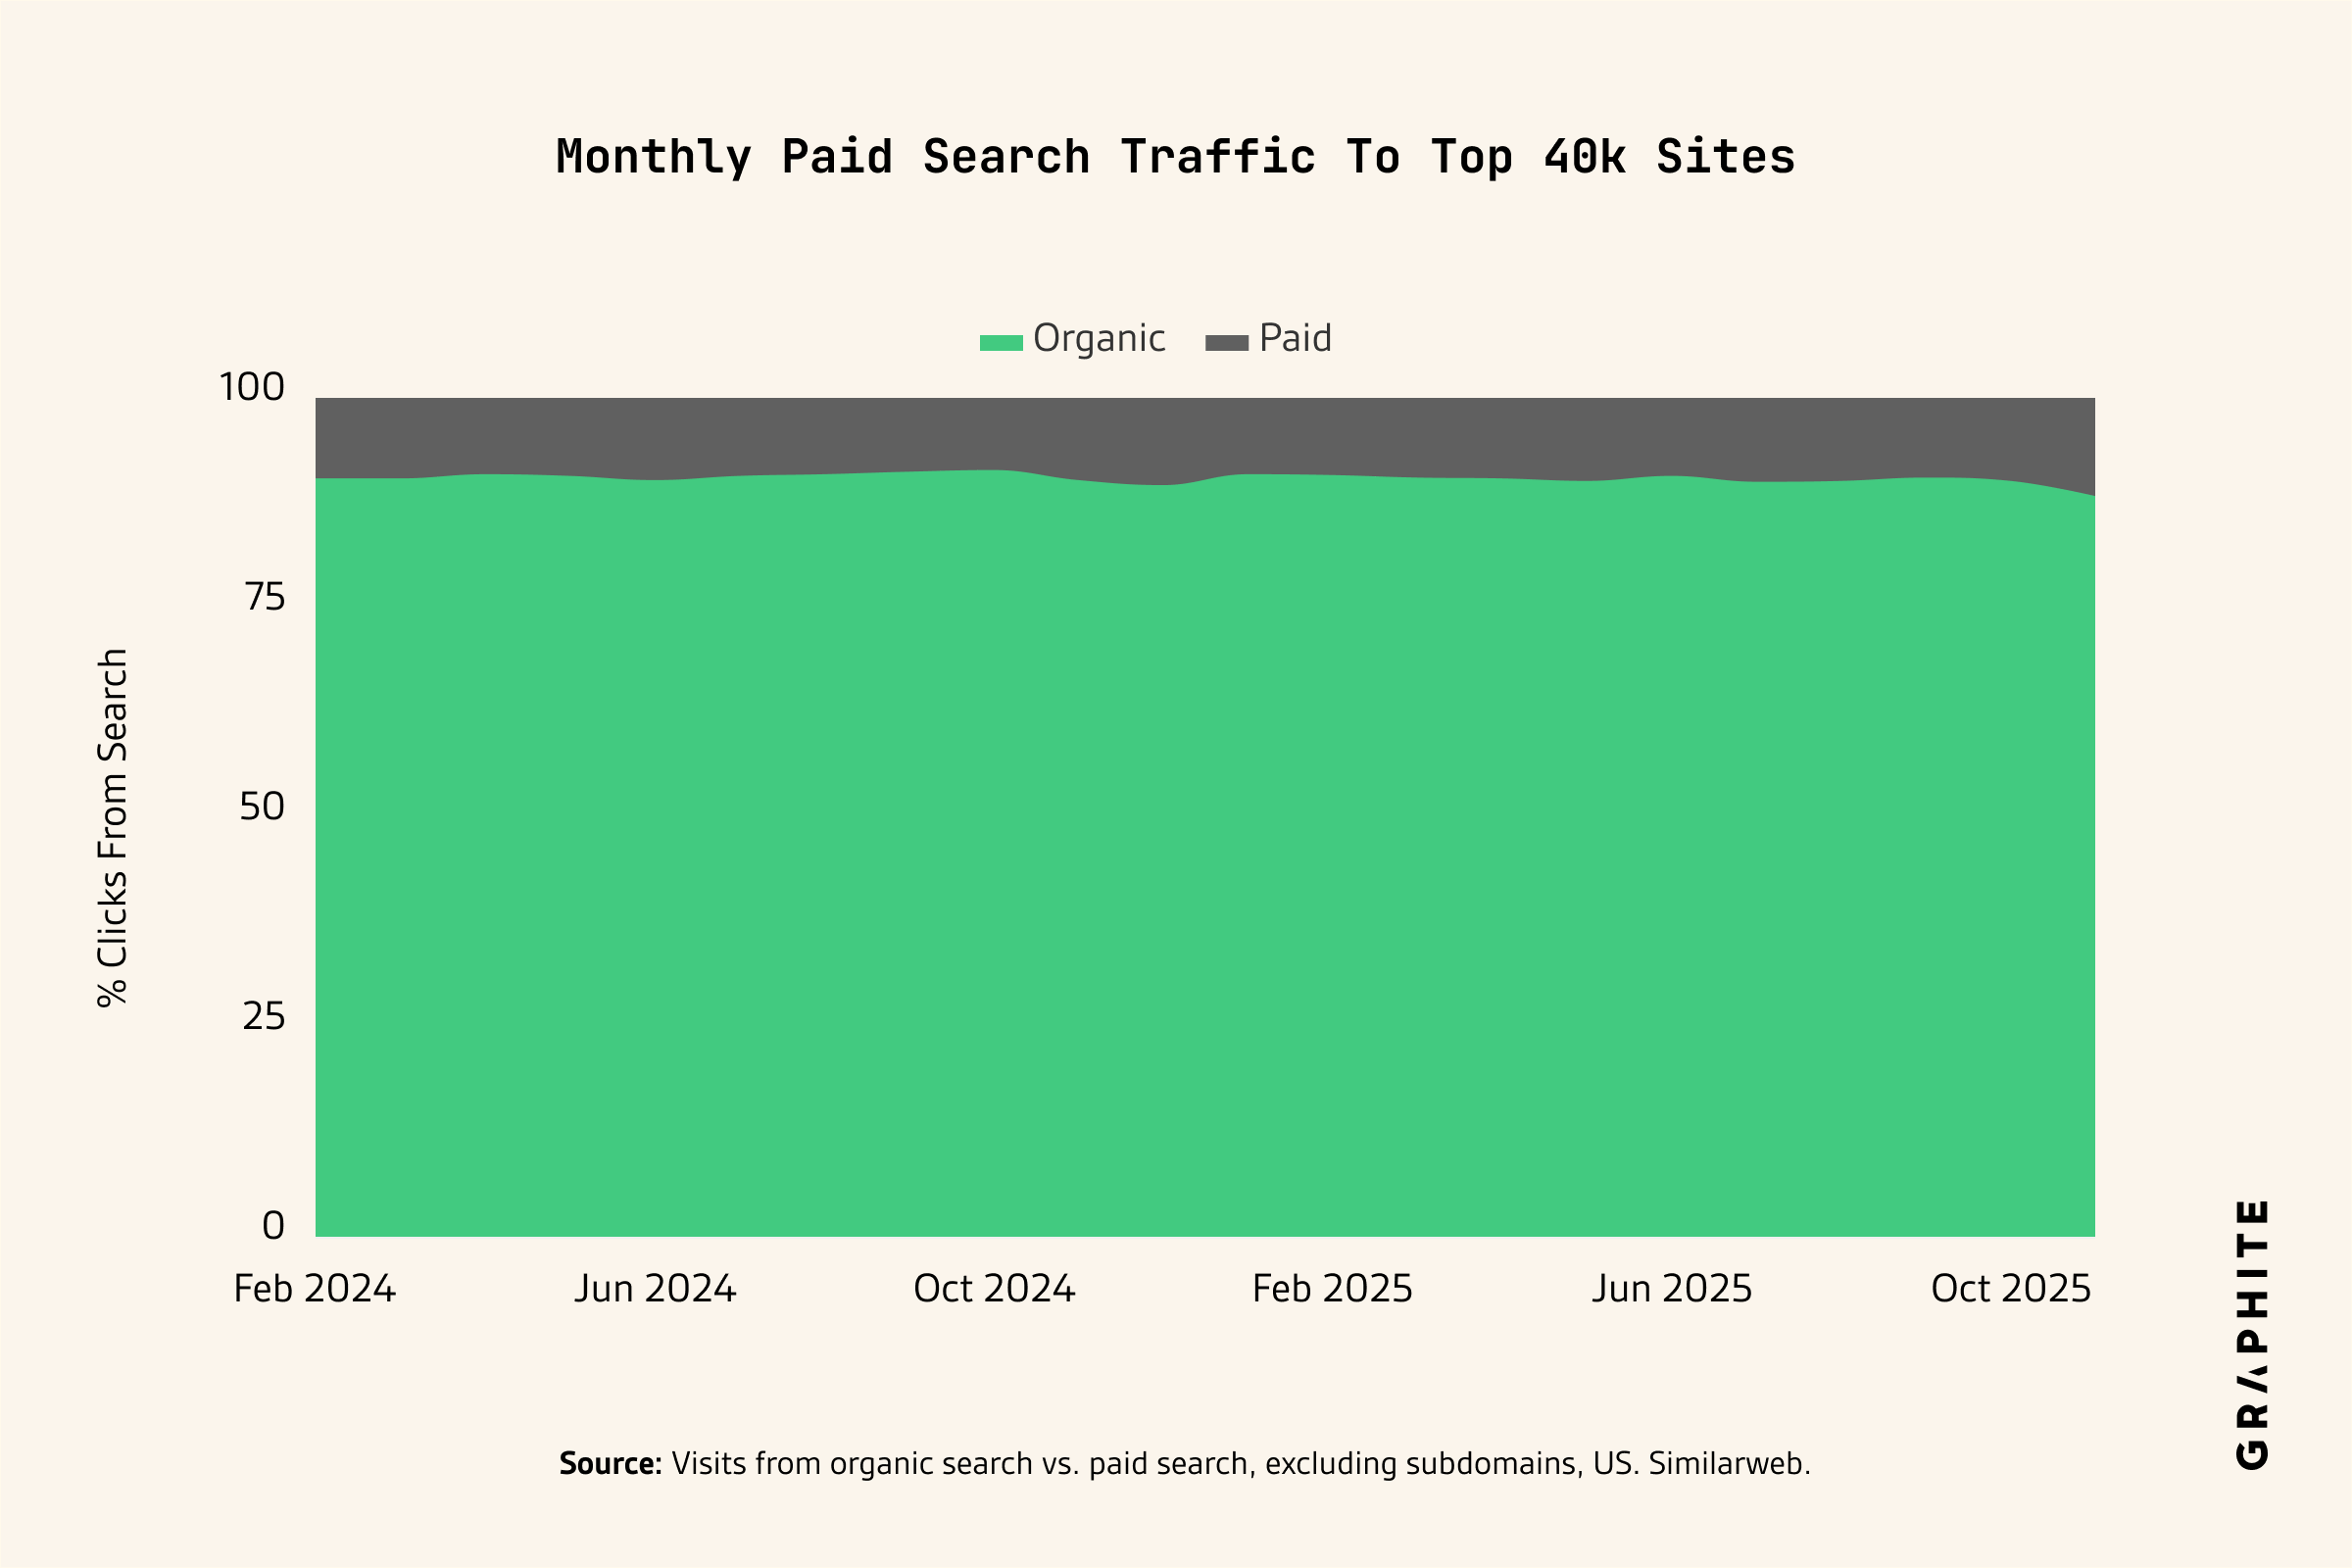
The Truth: While the share of clicks going to ads vs. organic has shifted, the difference is minimal. The ratio of clicks on Google that go to organic results vs. ads has decreased 7%. However, 90% of all clicks from Google go to organic results, and only 10% go to paid.
Data: We looked at over 42k sites with the most traffic, all with 100k+ visits/mo in the US. We include organic search traffic (all search engines) going to these sites, excluding traffic from Google via sub-domains such as maps.google.com or mail.google.com.
Clicks to Ads Has Increased (+2.1%)
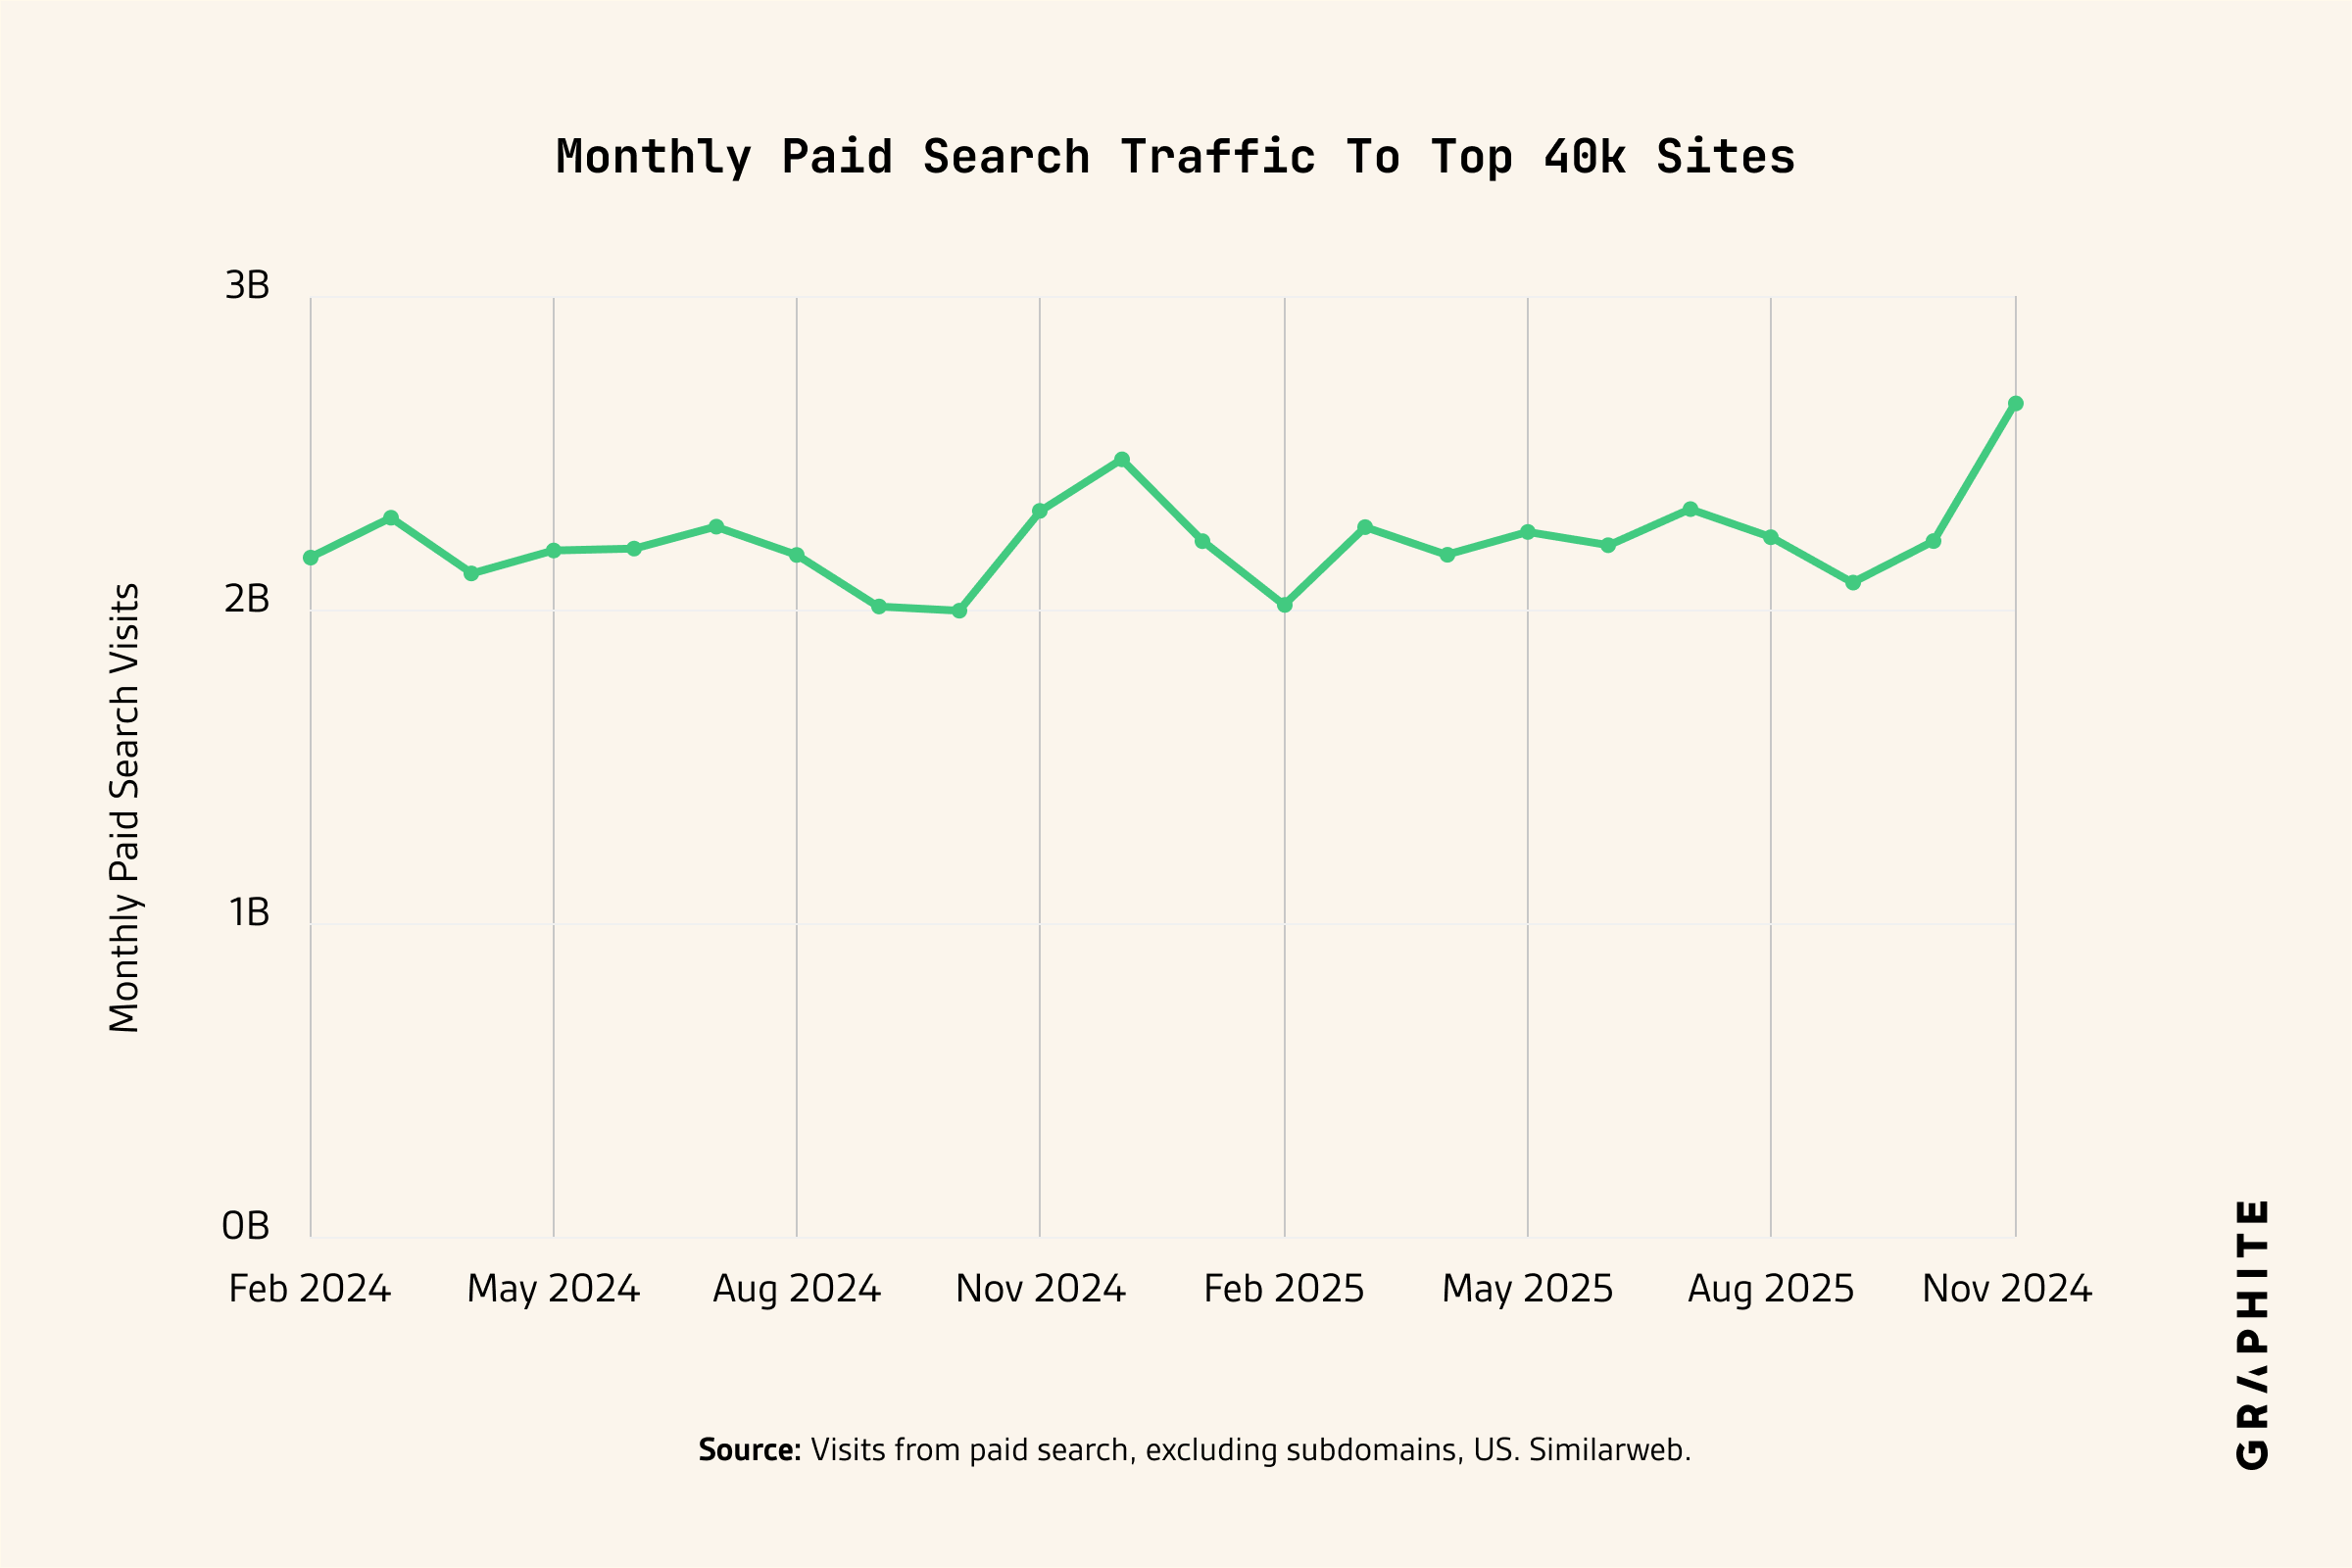
But, 90% of Clicks from Google Are Still Organic
AI Overviews Does Decrease CTR, but Less Often Than You Think
The Myth: AI Overviews has dramatically reduced CTR in search.
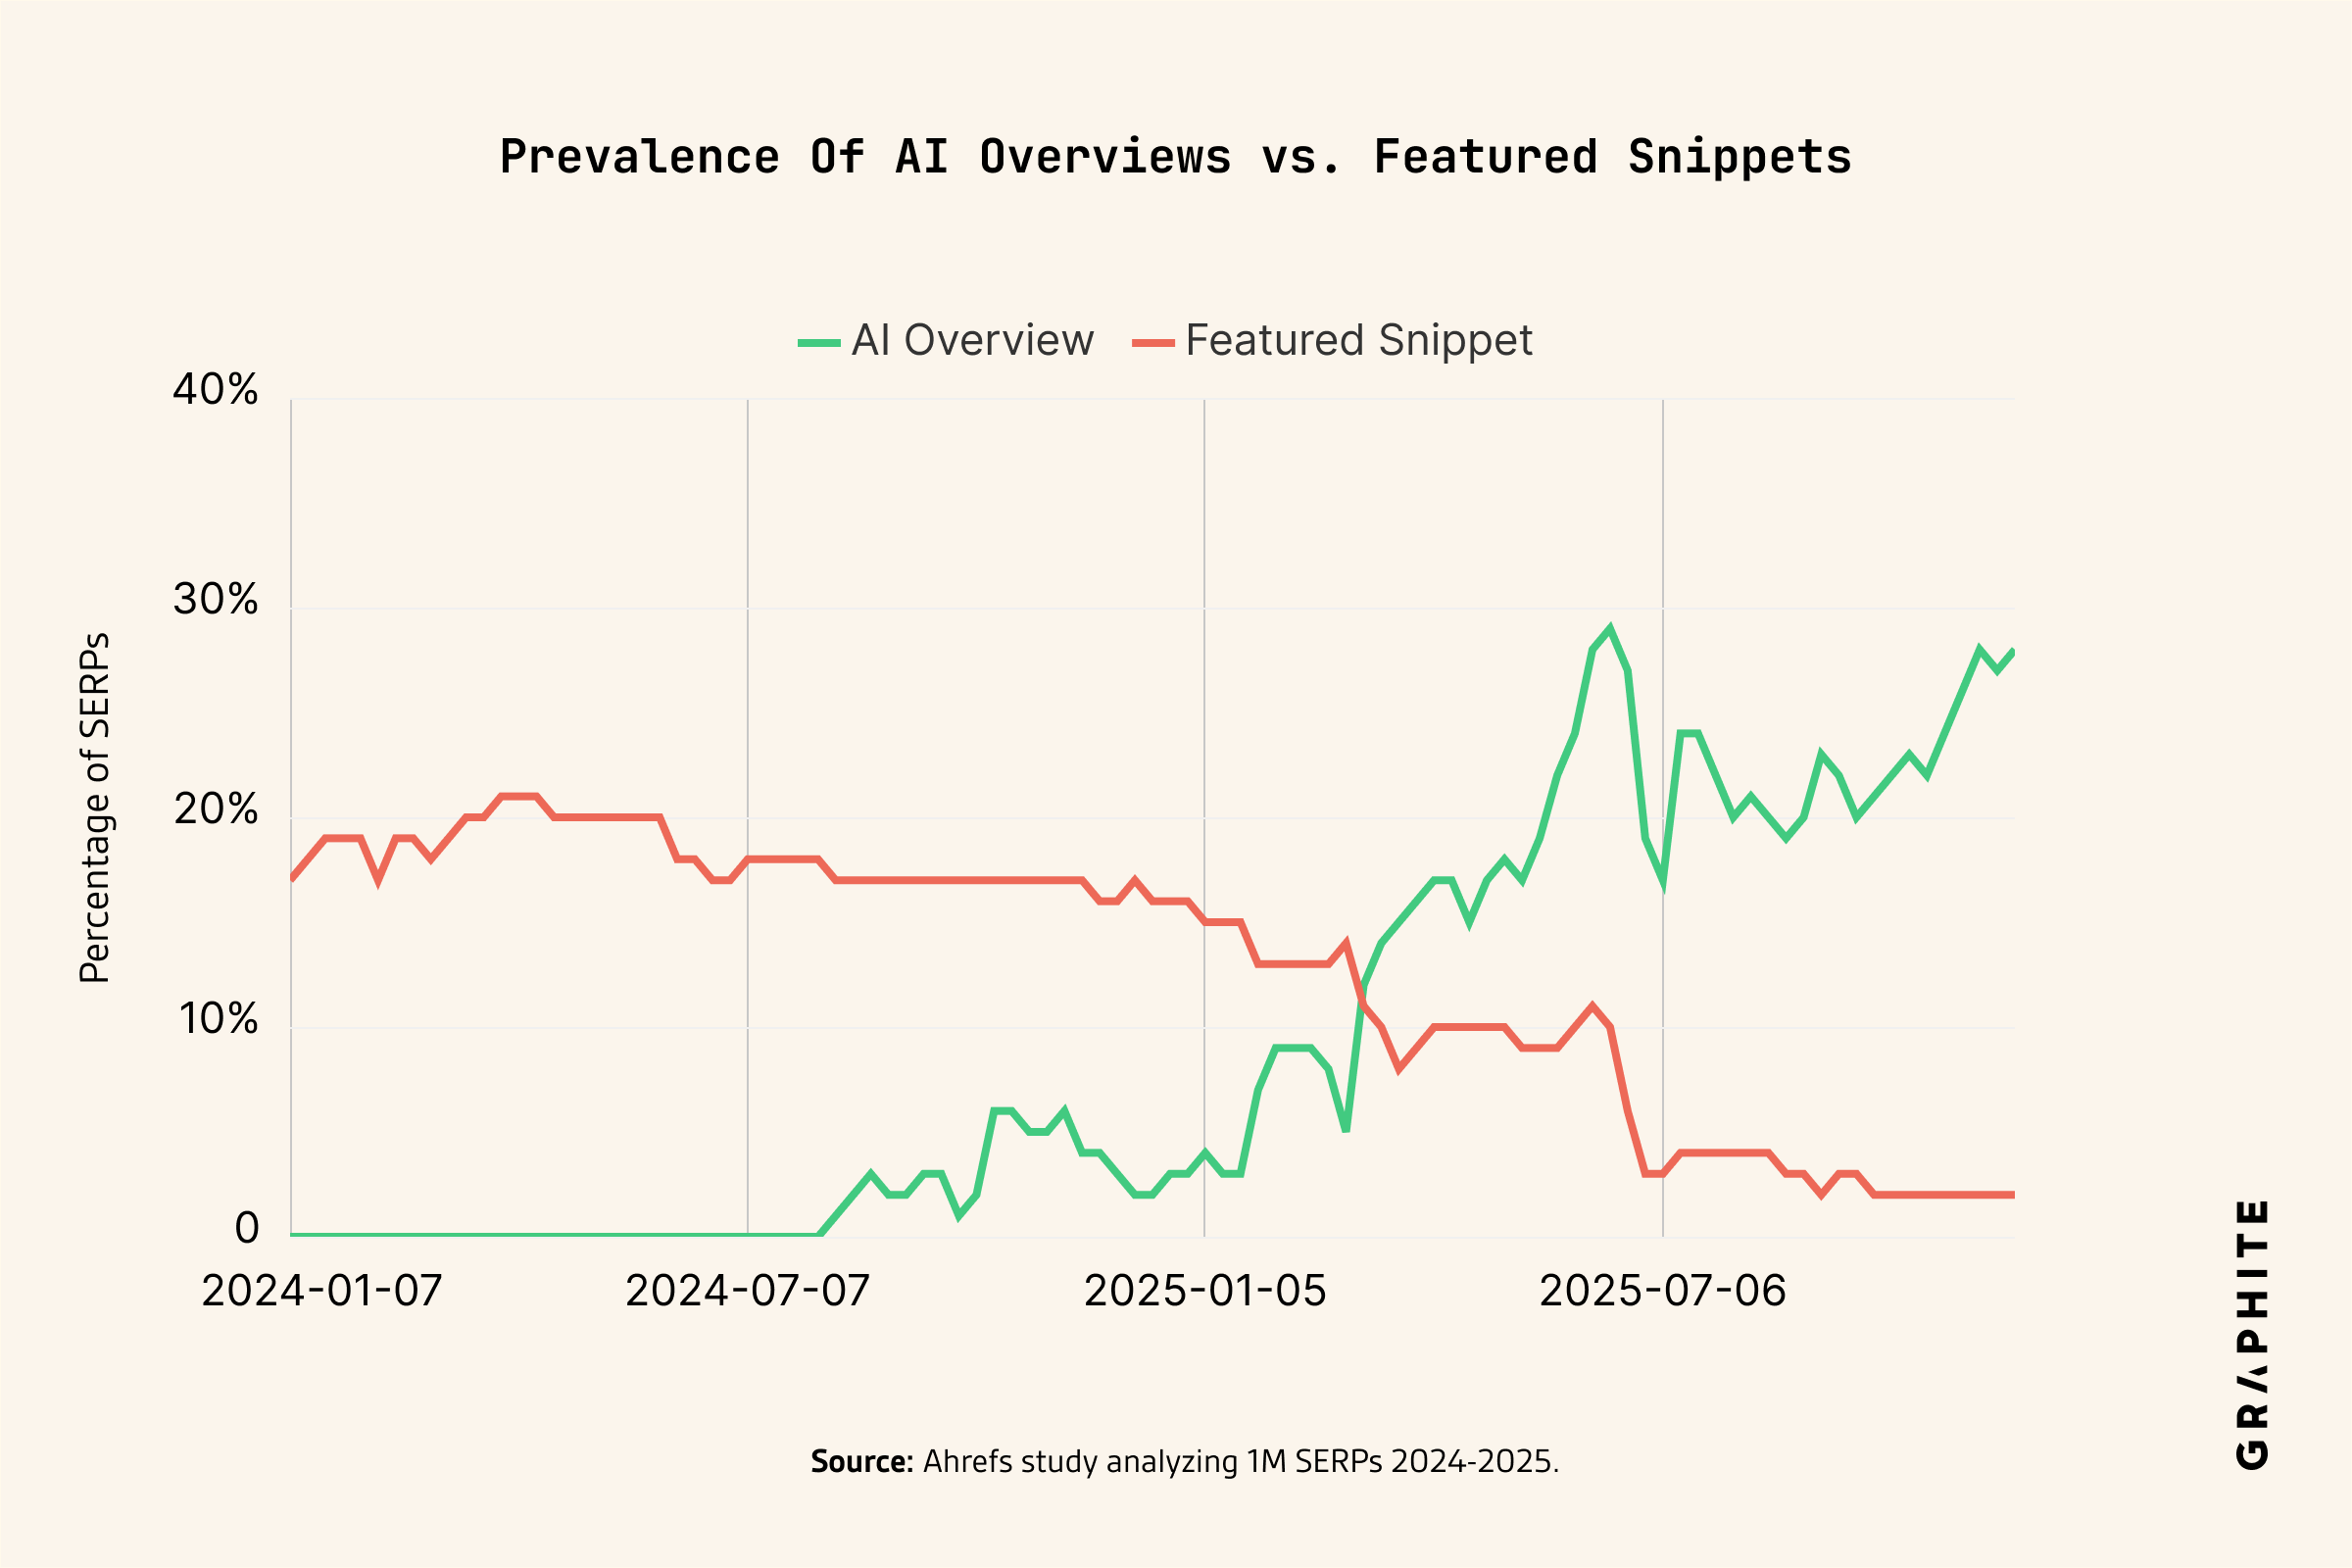
The Truth: AI Overviews does decrease CTR considerably (-35%), but it only appears 30% of the time. Featured Snippets also decrease CTR. AI Overviews has replaced Featured Snippets, which used to appear 20% of the time.
Data: An analysis from Ahrefs in July 2025 observing the prevalence of AI Overviews over 1M SERPs. A second analysis from Ahrefs in April, evaluating the effect on CTR, observing 300k keywords.
AI Overviews Decreases CTR by -35%
But, AI Overviews Only Appears 30% of the Time
Ahrefs published another study looking at 1M SERPs to assess how often AI Overviews appeared as compared with Featured Snippets.
- In contrast to other studies claiming AI Overviews appears 50% of the time, instead, it found that it appears 30% of the time.
- AI Overviews primarily appears for informational keywords, not commercial or transactional terms. So, it is taking clicks for the least valuable keywords. The most valuable keywords are largely unaffected.
- AI Overviews does appear more often on non-brand. AIO appears on 13% of branded keywords and 25% of non-brand keywords.
Data
All source data is available in the public Graphite × Similarweb spreadsheet.
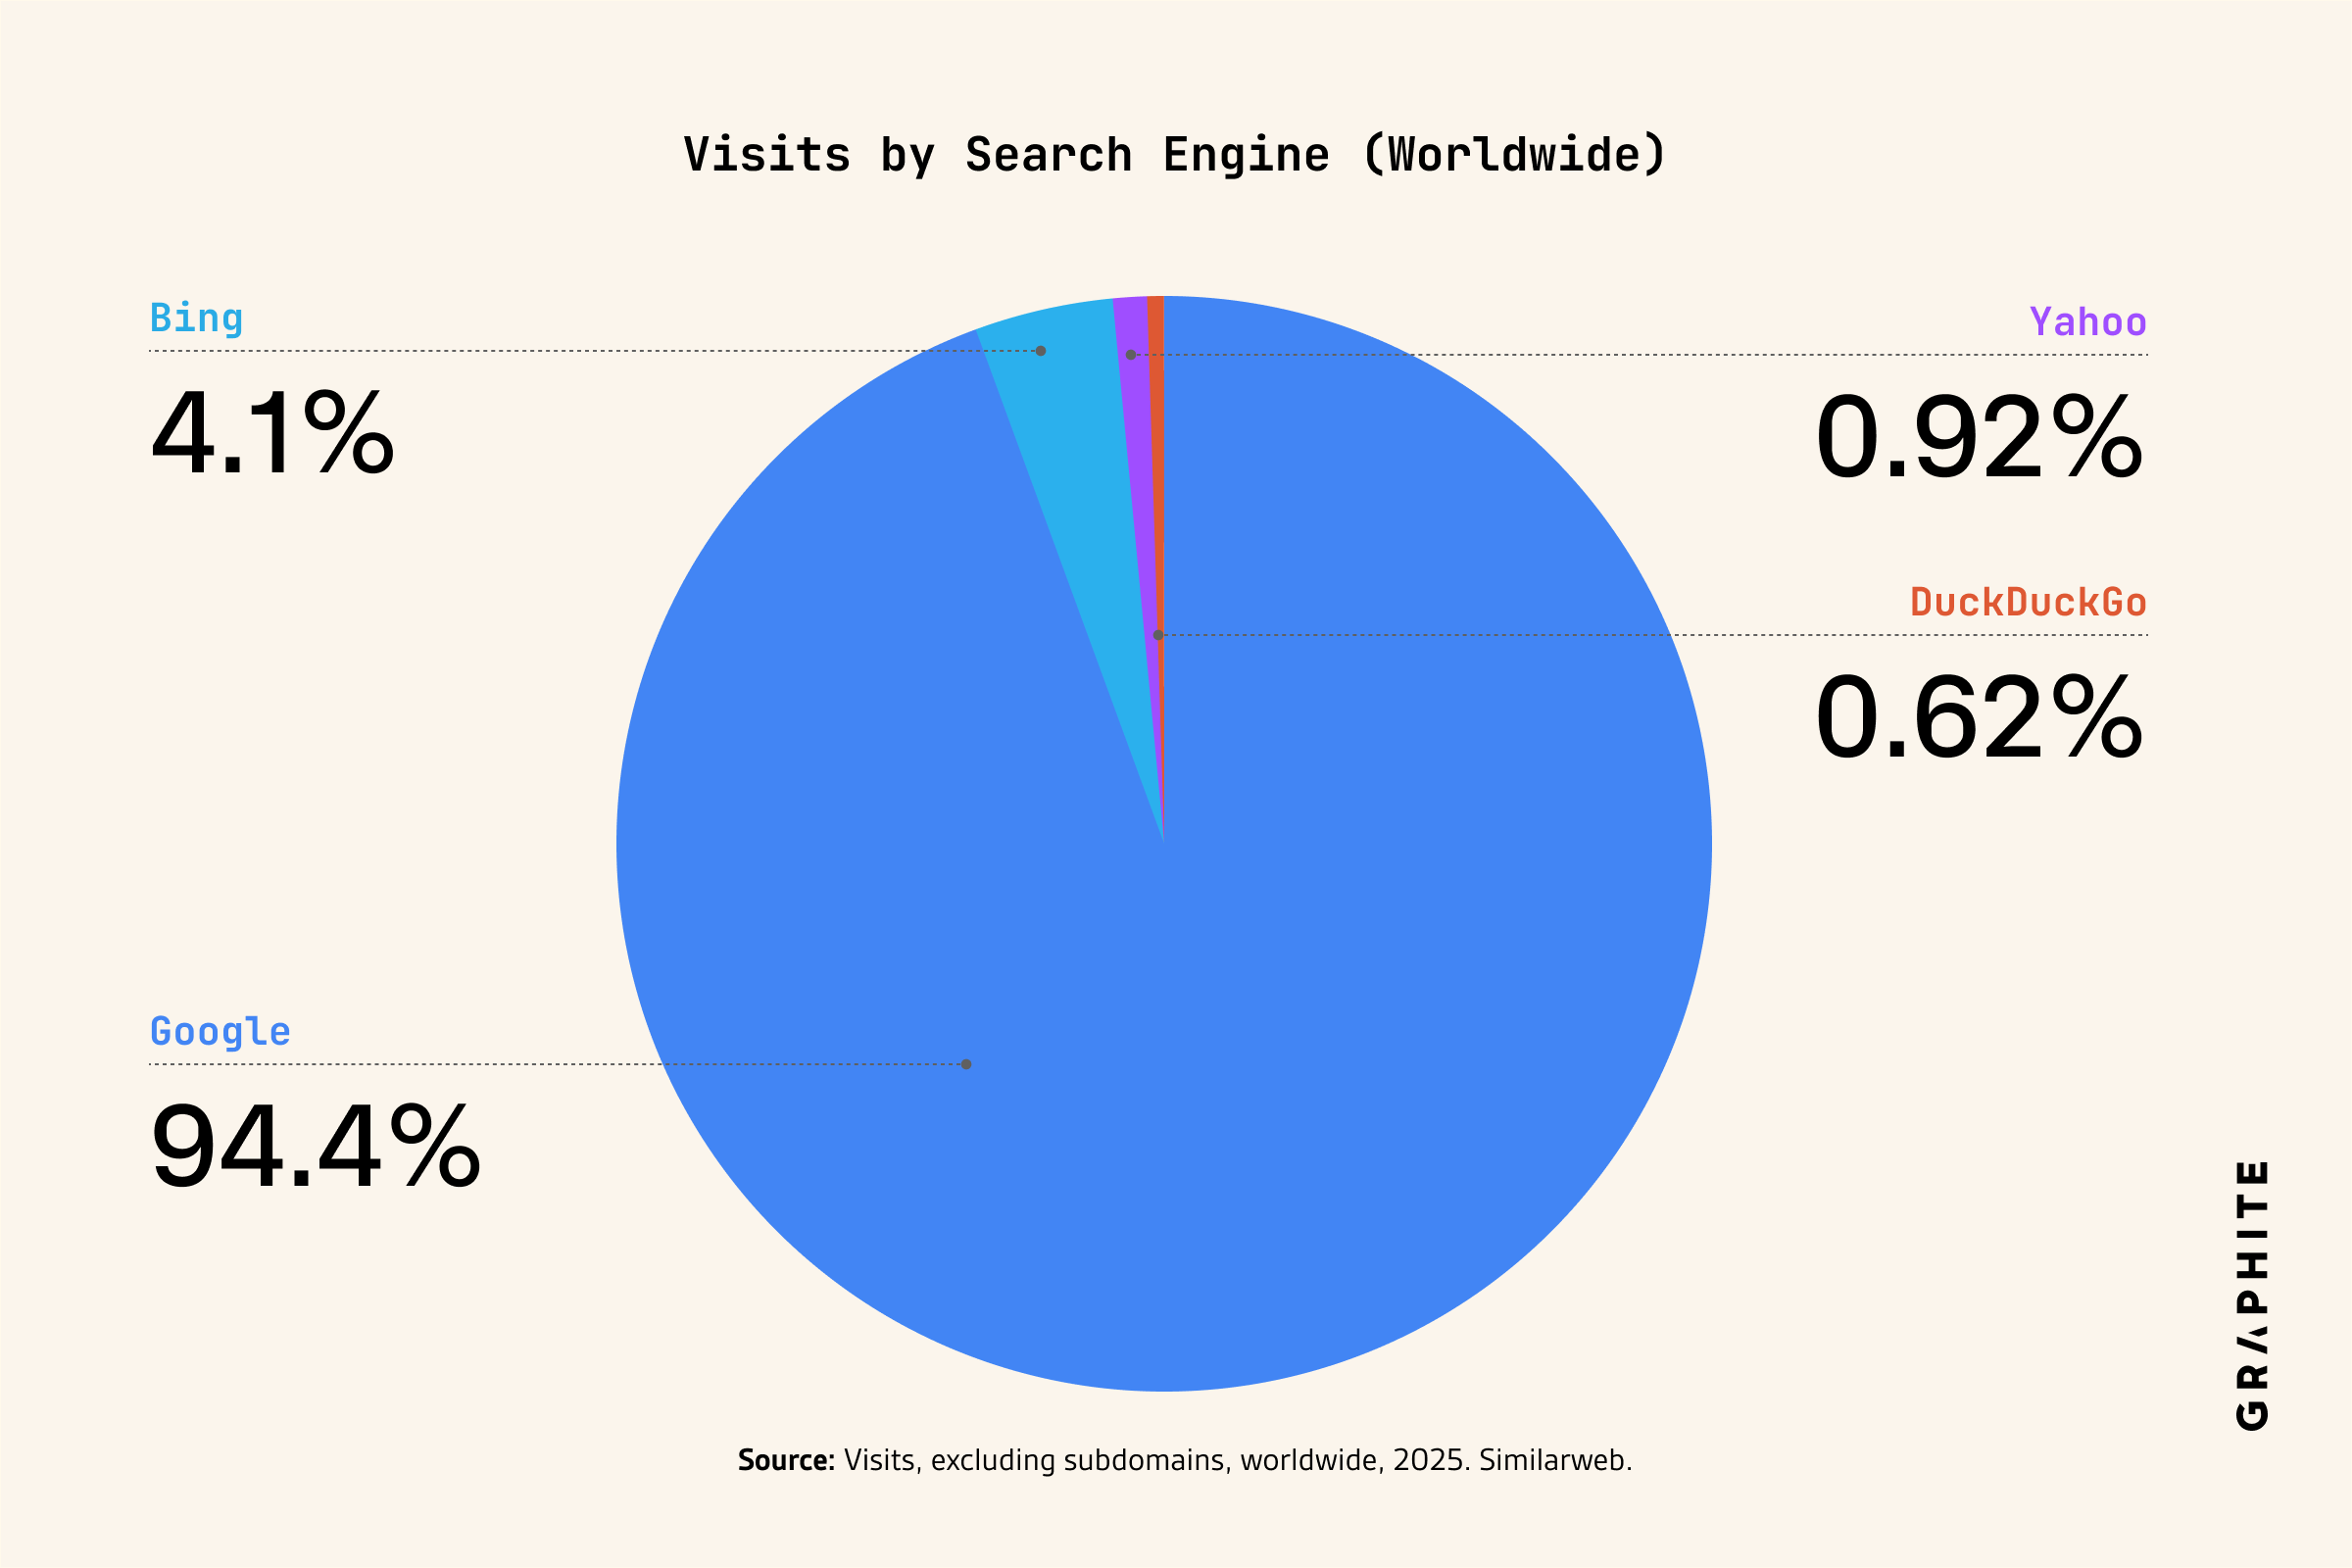
Year-Over-Year Visits to Search Engines (Worldwide)
| Worldwide | Bing | Yahoo | DuckDuckGo | Top 4 Search Engines | YoY % Change | |
|---|---|---|---|---|---|---|
| 2019 | 836.8B | 9.6B | 13.4B | 5.4B | 865.2B | — |
| 2020 | 883.6B | 21.3B | 12.2B | 7.8B | 924.9B | -6.90% |
| 2021 | 903.3B | 31.3B | 10.7B | 11.4B | 956.8B | +3.44% |
| 2022 | 889.3B | 31.5B | 10.3B | 11.1B | 942.2B | -1.53% |
| 2023 | 867.1B | 34.5B | 12.8B | 10.1B | 924.5B | -1.87% |
| 2024 | 850.1B | 38.5B | 13.7B | 9.4B | 911.7B | -1.39% |
| 2025 | 856.7B | 38.3B | 11.6B | 8.7B | 915.2B | +0.39% |
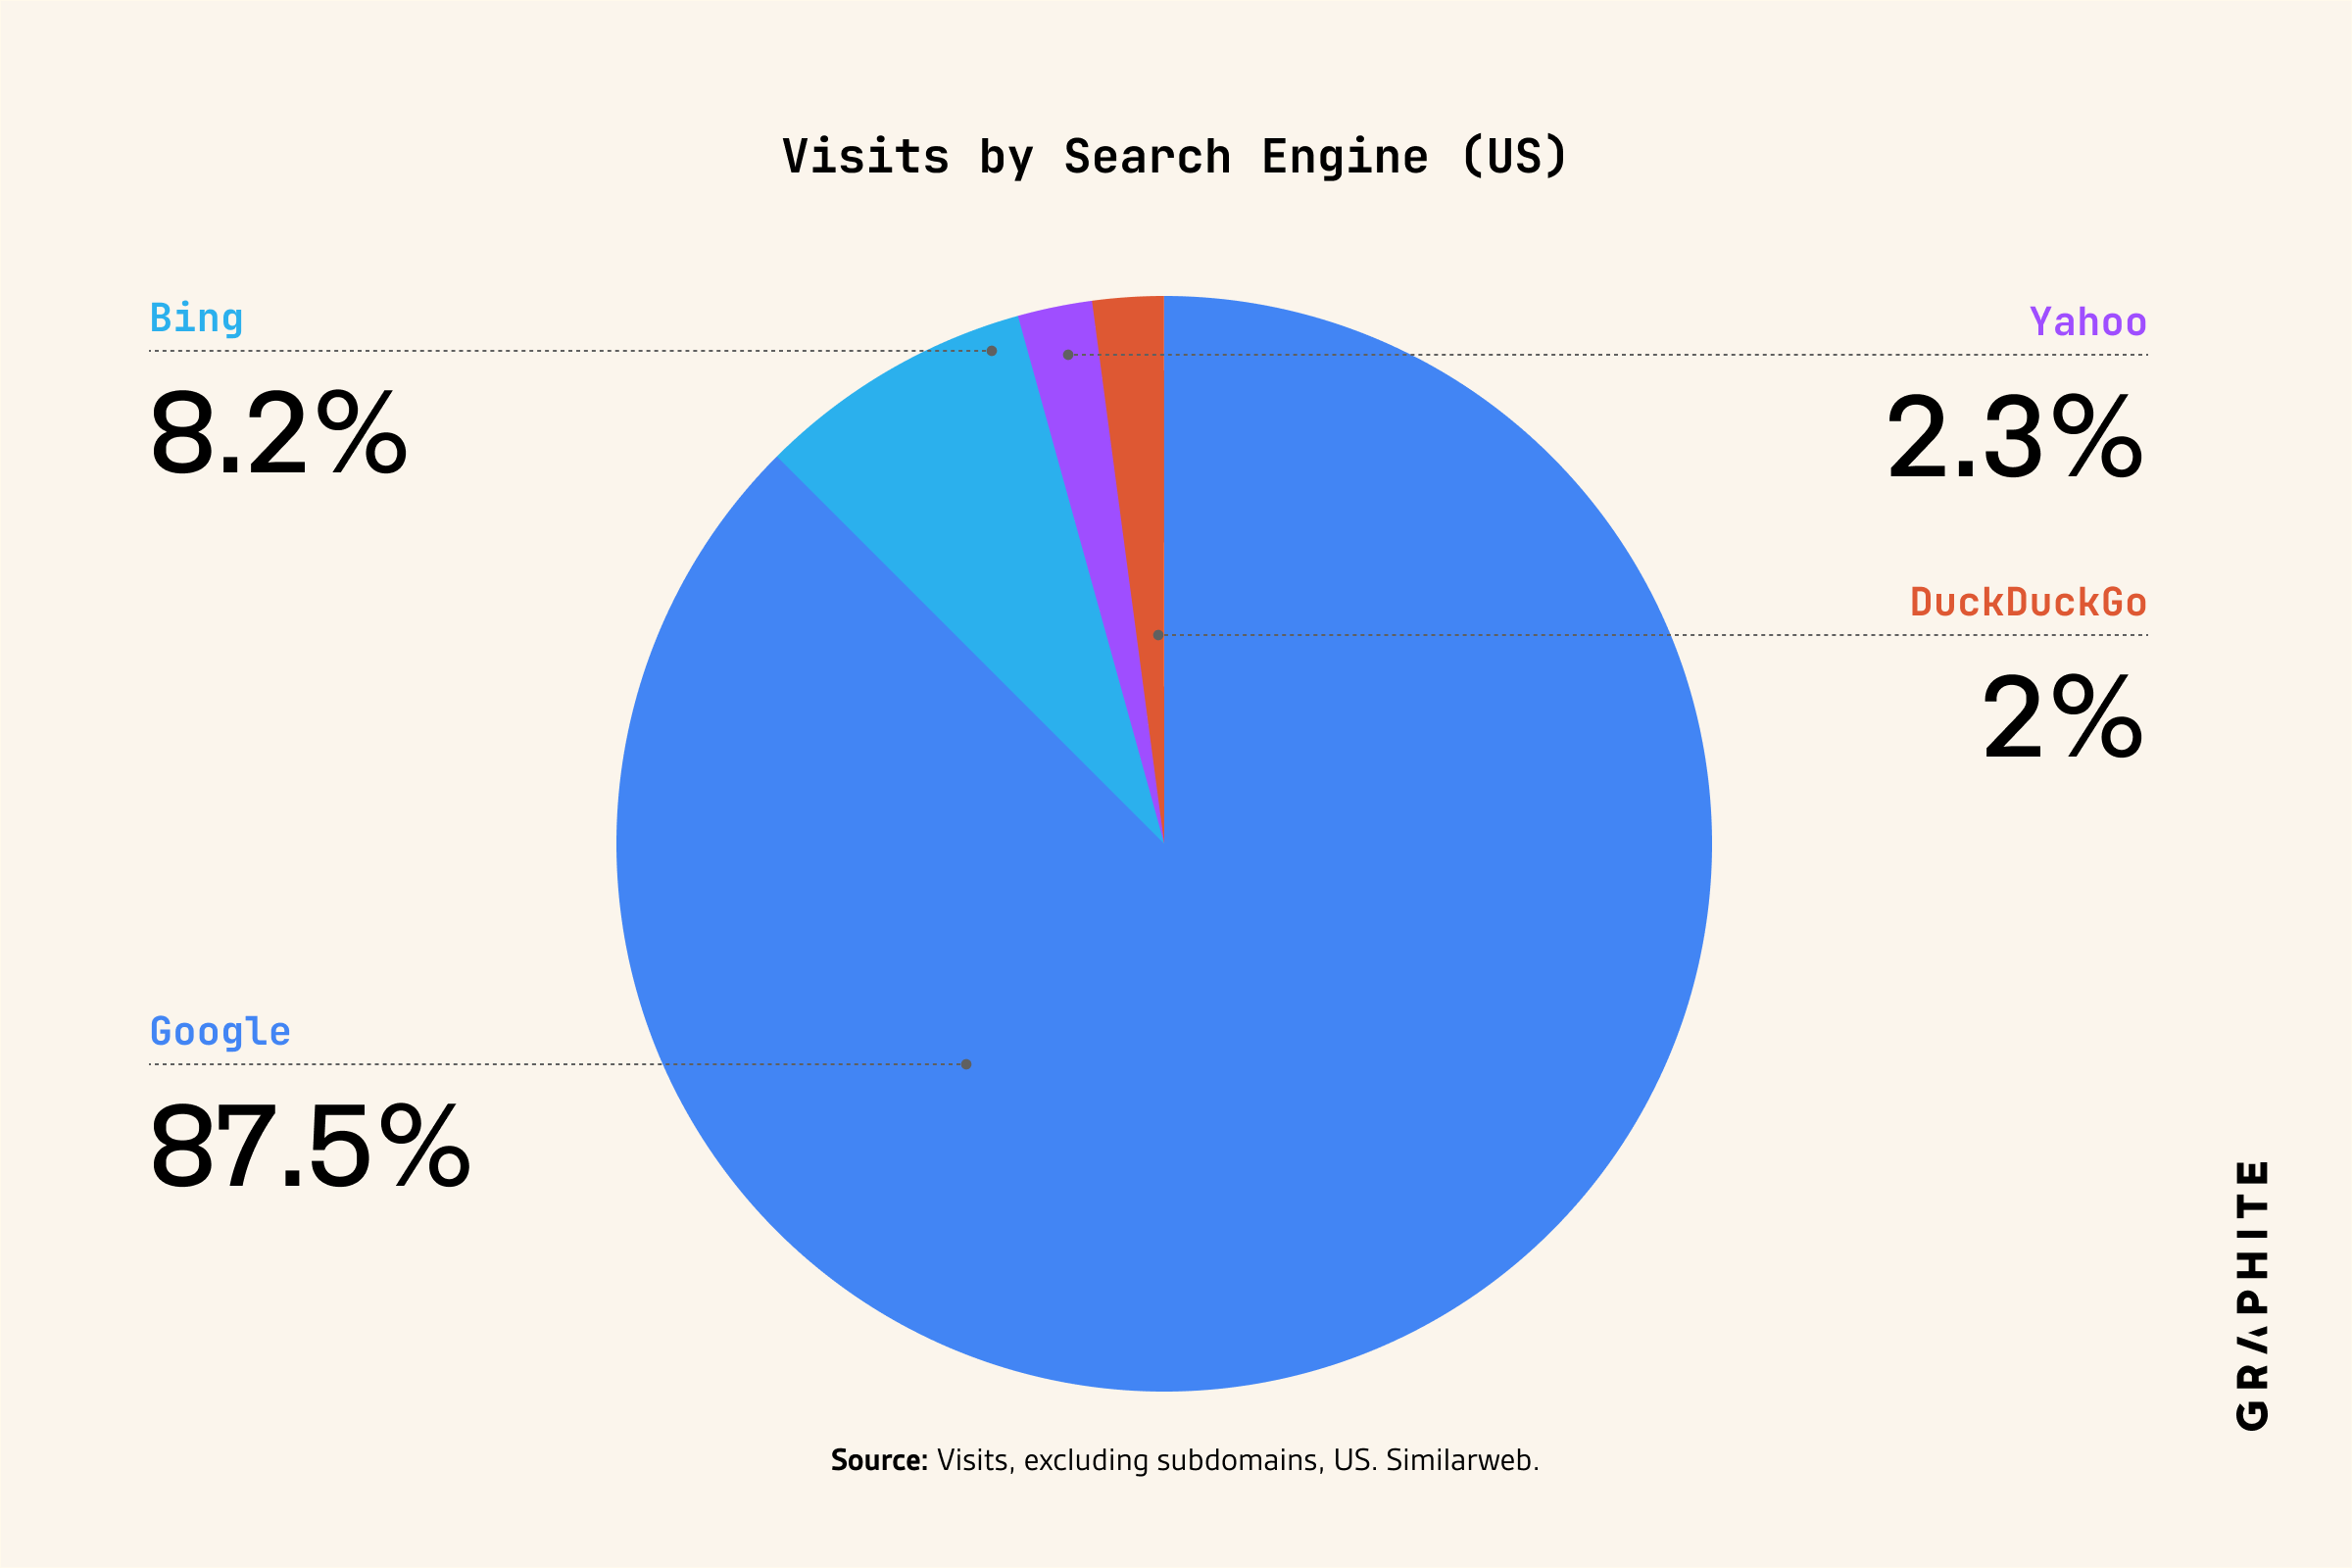
Year-Over-Year Visits to Search Engines (US)
| US | Bing | Yahoo | DuckDuckGo | Top 4 Search Engines | YoY % Change | |
|---|---|---|---|---|---|---|
| 2019 | 157.8B | 3.8B | 5.5B | 2.5B | 169.6B | — |
| 2020 | 171.4B | 9.3B | 5.1B | 3.9B | 189.7B | +11.84% |
| 2021 | 177.5B | 14.2B | 4.9B | 5.6B | 202.3B | +6.61% |
| 2022 | 174.2B | 14.3B | 4.8B | 5.4B | 198.7B | -1.77% |
| 2023 | 168.8B | 15.2B | 5.4B | 4.9B | 194.3B | -2.19% |
| 2024 | 168.0B | 16.3B | 5.8B | 4.3B | 194.4B | +0.05% |
| 2025 | 167.7B | 16.9B | 4.9B | 4.0B | 193.5B | -0.46% |
Company Disclosures of User Metrics
| Company / Product | Metric Type | Cadence | Value | Time Period Stated | Geography | Source Snippet (Verbatim / Near-Verbatim) |
|---|---|---|---|---|---|---|
| Google Search | Searches | Yearly | >5 trillion | “annually” (disclosed 2024) | Global | “We already see more than 5 trillion searches on Google annually.” |
| Google Search – AI Overviews | Users reached | Monthly (implied reach, not MAU) | >2 billion | Q3 2025 | Global | “AI Overviews… we’re now scaled to over two billion users.” |
| Google Search – AI Mode | Active users | Daily | 75+ million | Q3 2025 | Global | “AI Mode now has over 75 million daily active users.” |
| Google Gemini (App) | Searches | Monthly | 650+ million | Q3 2025 | Global | “The Gemini app now has over 650 million monthly active users.” |
| Bing Search | Active users | Daily | 140+ million | April 2024 | Global | “Bing reached over 140 million daily active users.” |
| Bing (New Bing) | Active users | Daily | 100+ million | March 2023 | Global | “Bing has surpassed 100 million daily active users.” |
| Bing (New Bing) | Chats | 30-day period | 100+ million | “annually” (disclosed 2024) | Global | “We have delivered over 100 million chats in the past 30 days.” |
| Yahoo (all properties) | Active users | Monthly | ~900 million | Nov 2022 | Global | “Reaching nearly 900 million monthly active users worldwide.” |
| DuckDuckGo | Searches | Daily | 110,439,133 | Jan 2022 | Global | “The highest daily number of queries… was 110,439,133.” |
Definition of Metrics
Visits
A “visit” to a website is counted when a visitor accesses one or more pages during a session. Subsequent pageviews are included in the same visit until the user is inactive for more than 30 minutes. If a user becomes active again after 30 minutes, that counts as a new visit. A new session will also start at midnight.
Pageviews
A pageview is a request to load (or reload) a single page of a website. This metric represents any change in URL within the domain, unique or not, within a visit.
Visitors
A user who arrived at a site once or a number of times is a single unique visitor to that domain. We see a unique ID per device through our contributory network, which is translated into a unique user. Unlike other traffic analysis tools, Similarweb does not rely on cookies, which is considered an unstable methodology since cookies are susceptible to being manually or automatically deleted. For that reason, the cookie-based methodology will tend to overestimate unique visits and therefore show a higher number than what you’ll find in Similarweb data.
Deduplicated Audience
Deduplicated Audience offers insight on the number of users generating website visits across desktop and mobile web. To estimate the size of deduplicated audiences, Similarweb uses a learning set and linear regression modeling to build an algorithm that can estimate the size of a website’s deduplicated monthly visitors.
Incentives & Biases of the Author
The author, Ethan Smith, is the CEO of Graphite.io, a growth agency that offers services focused on SEO and AEO. Therefore, it is in the financial interest of the author to argue that SEO is a large channel and is not decreasing.
Researchers

Founder and CEO of Graphite, the research-driven growth agency behind work for Webflow, Adobe, and Upwork. Teaches SEO and AEO at Reforge and is an adjunct professor at IE Business School. Research published in the Financial Times, Axios, and The Atlantic. Previously a growth advisor to Masterclass, Robinhood, and Honey.
Read Full Bio