
This is a highly condensed version of Demystifying Randomness in AI.
About the Authors
Gregory Druck is Chief AI Officer at Graphite.io, where he leads a team of scientists and engineers building AI tools for growth and researching how AI is reshaping marketing. Previously, he was the Chief Data Scientist at Yummly, where he built NLP and computer vision systems for the smart kitchen. Prior to Yummly, he was an NLP and search researcher at Yahoo! Research, with internships at Google and Microsoft. He earned a Ph.D. from the University of Massachusetts Amherst, where he worked on semi-supervised and active machine learning with Andrew McCallum.
Ethan Smith is CEO of Graphite.io, a research-driven growth agency that works with companies like Webflow, Adobe, and Upwork. He is an adjunct professor at IE Business School and teaches SEO and AEO at Reforge. His research has been published in ACM, Axios, Financial Times, and The Atlantic. Prior to founding Graphite, Ethan was a growth advisor to Masterclass, Robinhood, and Honey. Ethan was a research assistant focused on human-computer interaction and psychology at UC Santa Barbara and University College London.
AI Visibility and Position Are Measurable
AI Responses Vary
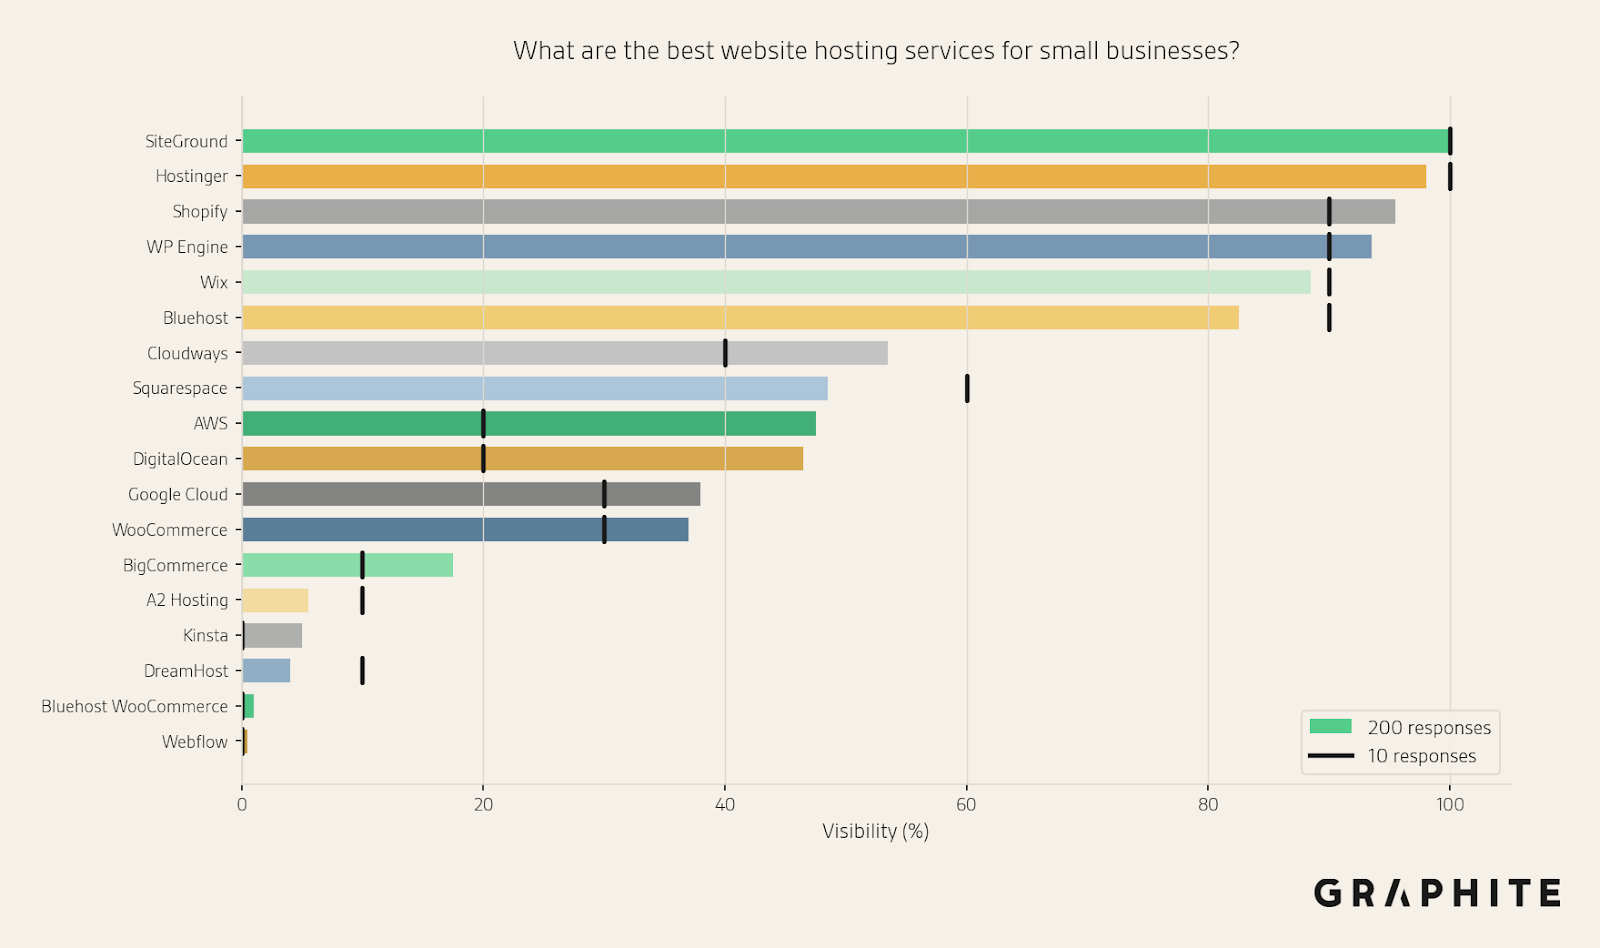
If we give AI the same prompt multiple times (in different chat windows), we will generally get different responses each time. For example, here are the visibilities of entities using 200 responses to “What are the best website hosting services for small businesses?”. Some hosting services, like SiteGround, always appear, while others, like Squarespace, appear only occasionally.

LLM Responses Vary Because They Are Randomly Sampled from a Probability Distribution
AI is not incoherent. AI responses vary because Large Language Models (LLMs) generate responses by sampling from a probability distribution. Most of the variance we see in AI responses is due to this random sampling.
There is much more detail on this in the How LLMs Generate Text section of the full paper.
We Need a Sample of Responses for Prompt Tracking
Consequently, it is dangerous to infer anything from individual responses, but with a larger sample of responses, we can estimate the original distribution.
But how large does this sample need to be?
Visibility and Position Are Based on the Presence and Location of Individual Entities, Not the Entire Response
The fact that the exact same set of entities rarely appears in the same order does not mean visibility and position are unmeasurable, or that we need a massive sample. Imagine flipping a set of weighted coins simultaneously. The exact set of coins that land heads will be different each time, but we can still estimate how often each coin comes up heads.
As with Any Statistical Estimate, Error Decreases with More Samples, but with Diminishing Returns
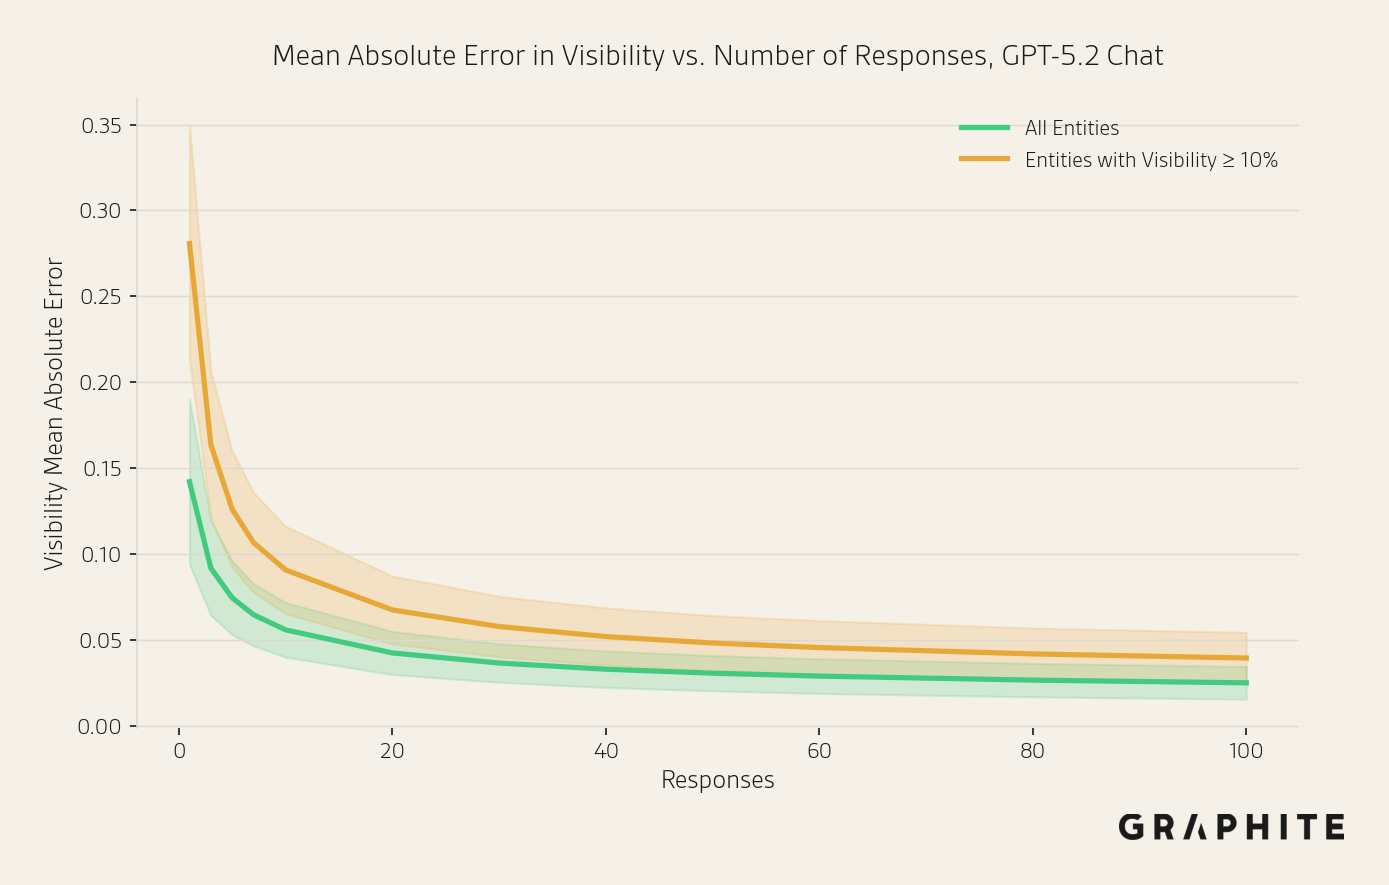
Estimation error decreases as we compute metrics over more responses, but there are diminishing returns to using a larger sample. The visibility estimates with 10 responses are not massively different from those with 200 responses. The following chart shows how the mean absolute estimation error decreases with the number of responses (using an independent sample of 200 responses as a proxy for ground truth).
Statistical Tools Can Help Us Measure Margins of Error
This is not a new problem. We can use statistical tools such as confidence intervals to estimate margins of error (without needing an estimate of the ground truth).
Practical Guidance for Measuring Visibility and Position
What information do marketers need from prompt tracking?
Coarse Estimates Are Often Sufficient
If the goal is to understand whether a brand appears frequently or rarely, distinguishing between 70% and 80% visibility matters less than distinguishing between 70% and 10%. The actions taken as a result of prompt tracking, such as publishing content or adjusting messaging, typically depend on coarse thresholds rather than precise values.
When Precision Is Required, Use Statistical Tools
When more precision is required, we can do the following:
- Use confidence intervals, statistical margins of error that do not require ground truth estimates.
- Do sequential sampling: iteratively add responses until the confidence intervals are small enough for your application.
- Conduct statistical hypothesis tests to measure whether differences in metrics are real.
One specific example where greater precision is likely required is measuring the impact of an initiative, e.g., publishing new content. While a sample of 10 responses can provide a coarse estimate, it is unlikely to be sufficient to detect a moderate change (e.g., the difference between 50% and 75% visibility, rather than 25% vs. 75%). In this setting, we can take a larger sample to get tighter confidence intervals using sequential sampling, and then check whether confidence intervals overlap or use a statistical hypothesis test.
Focus on Visibility, Then Position
If visibility is low, focus on increasing visibility before tracking position.
Tracking Visibility
Coarse estimate: Do not rely on individual estimates. Run each prompt at least 10 times. With 10 responses, the mean absolute error in visibility estimates is 5.6%, and 98.6% of prompts have a mean absolute error <= 10% after only 10 responses when using API. When scraping the responses are more variable, but the errors are similar.
The following figure shows the difference between estimates with 200 responses (the solid bars) and 10 responses (the black lines).
Statistical tools:
- Visibility can be modeled with a Binomial distribution.
- Conduct statistical hypothesis tests to measure differences
- Use Wilson score confidence intervals
See the Tracking Visibility section of the full paper for detailed experiments and explanations.
Tracking Position
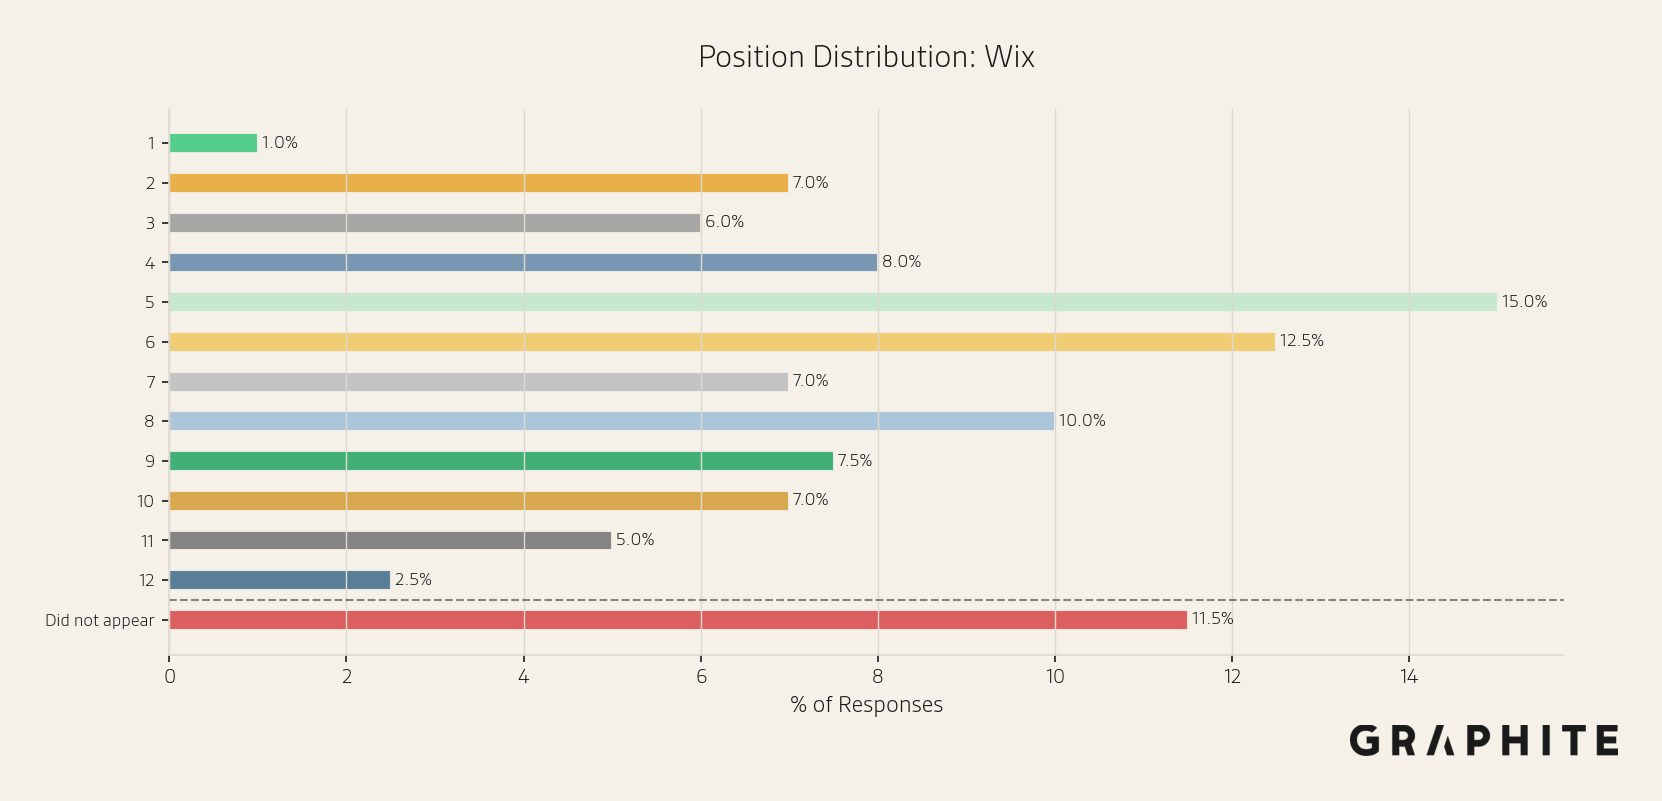
The position of an entity in a response is its order relative to other entities, based on its first appearance in the response. Note that position is only defined when the response contains a list of entities. To aggregate position for a sample of responses, we take the mean position across responses that mention the entity. Note that because position is defined only when an entity occurs, the effective sample size for measuring the average position depends on the entity's visibility. For this reason, we suggest tracking position only when an entity’s visibility is high.
A position histogram is a good way to visualize the variance in observed positions.
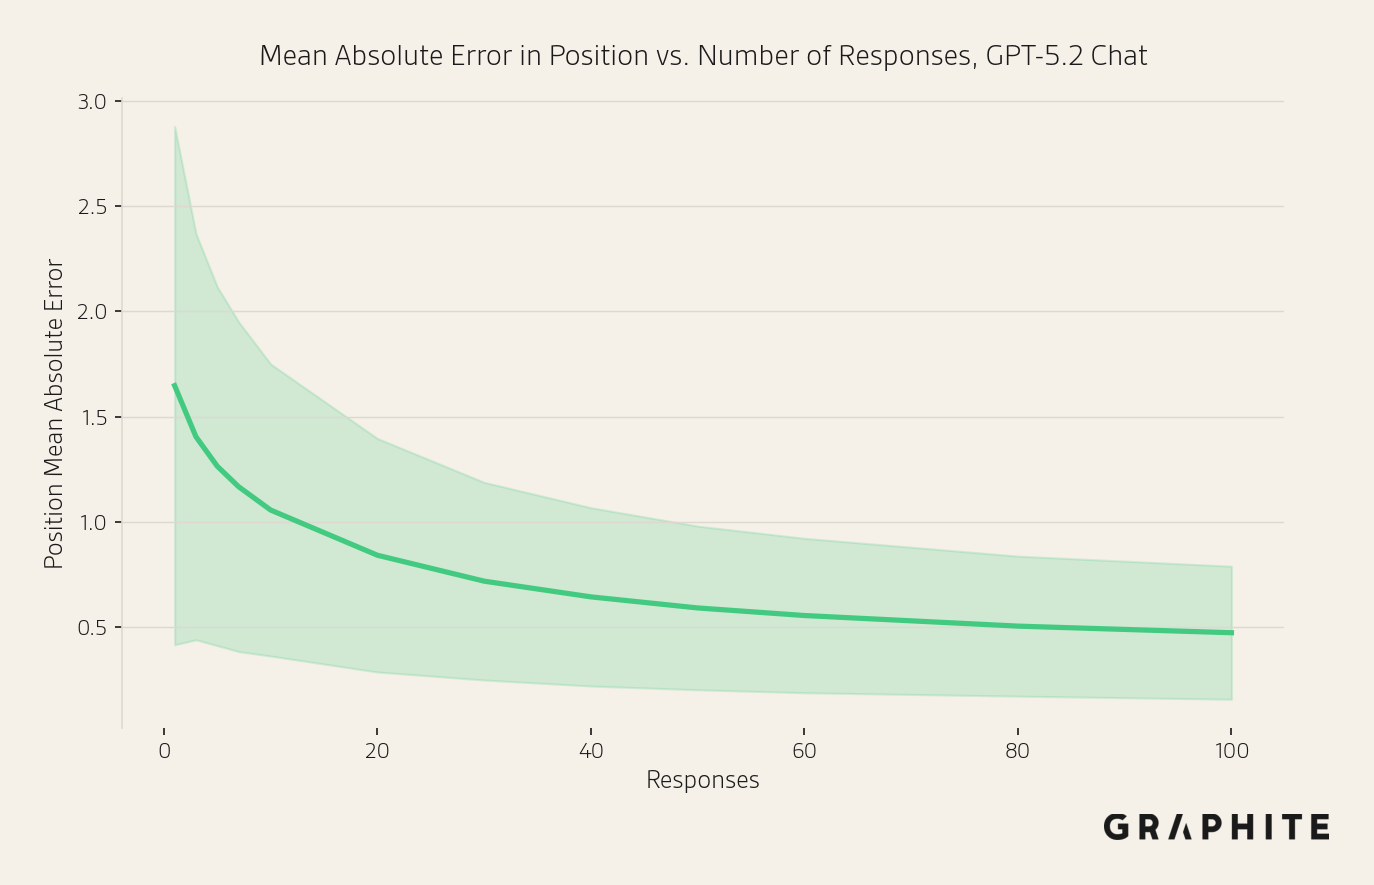
Coarse estimate: Similar to visibility, a sample of 10 responses is enough for a coarse estimate. By 10 responses, the mean absolute error in position is already just above one, at 1.06. With 10 responses, 90.6% of prompts have a mean absolute error <= 2 positions. While tracking position in scraped responses results in higher error than API, the absolute errors remain small.
Statistical tools:
- Average position can be estimated from the sample mean and standard deviation.
- Conduct statistical hypothesis tests to measure differences
- Use confidence intervals to assess the margin of error
See the Tracking Position section of the full paper for detailed experiments and explanations.
API Data vs. Scraped and Logged-In Data
The techniques we propose to inform the number of responses needed for prompt tracking generalize to any data collection method. In the paper, we experiment with API and scraped responses (which, while more variable, do not make visibility and position substantially harder to estimate). We are actively running experiments with responses collected from logged-in users, and initial results suggest a similar story.
See the API, Logged Out, and Logged In Responses section of the full paper for detailed experiments and explanations.
Summary of Recommendations
1. Do not rely on a single response. Instead, run each prompt at least 10 times for a quick estimate.
2. For more precise estimates, rather than gathering large numbers of responses by default, use sequential sampling: add responses iteratively until the confidence interval is sufficiently tight.
3. Use confidence intervals or statistical tests to decide if changes are real (make a copy of the provided sheet). Generally, be skeptical of small differences in visibility and position, especially for responses that do not use web search.
4. Track weekly or biweekly. If tracking daily, take care not to interpret noise as signal.
5. Use a new chat for each prompt and disable memory.
6. Focus on the right metric for your situation:
- Visibility (how often a brand appears) is the best initial metric, especially if your brand is not yet consistently mentioned.
- Position (how prominently a brand appears when it does appear) matters more when a brand already appears frequently, and the focus is on its placement relative to competitors.
7. Supplement prompt tracking tools by also manually gathering responses from AI with a logged-in account.