
Executive Summary
- Graphite conducted an AB test for a leading no-code platform to evaluate the impact of implementing our Internal Links API.
- The test group saw a significant increase in visibility within 50 days, with a 42.4% increase in average daily impressions.
- URLs with the lowest amount of traffic (Quartile I) experienced the biggest increase, with an increase of 172.4% in average daily clicks and 767.4% in average daily impressions, driven mostly by one URL.
Abstract
This document presents the findings from an AB test conducted between November 29, 2022, and January 10, 2023. The goal was to understand the impact of the Internal Links API on SEO performance.
199 URLs were divided into two groups: test and control. The URLs in the test group implemented the Internal Links API, while the URLs in the control group had no change. The specific number of links and which links were selected were chosen by the client to create a large enough and representative sample for the test.
The analysis found that the test group showed an overall increase of 6.4% in average daily clicks and 42.4% in average daily impressions compared to performance before the test started.
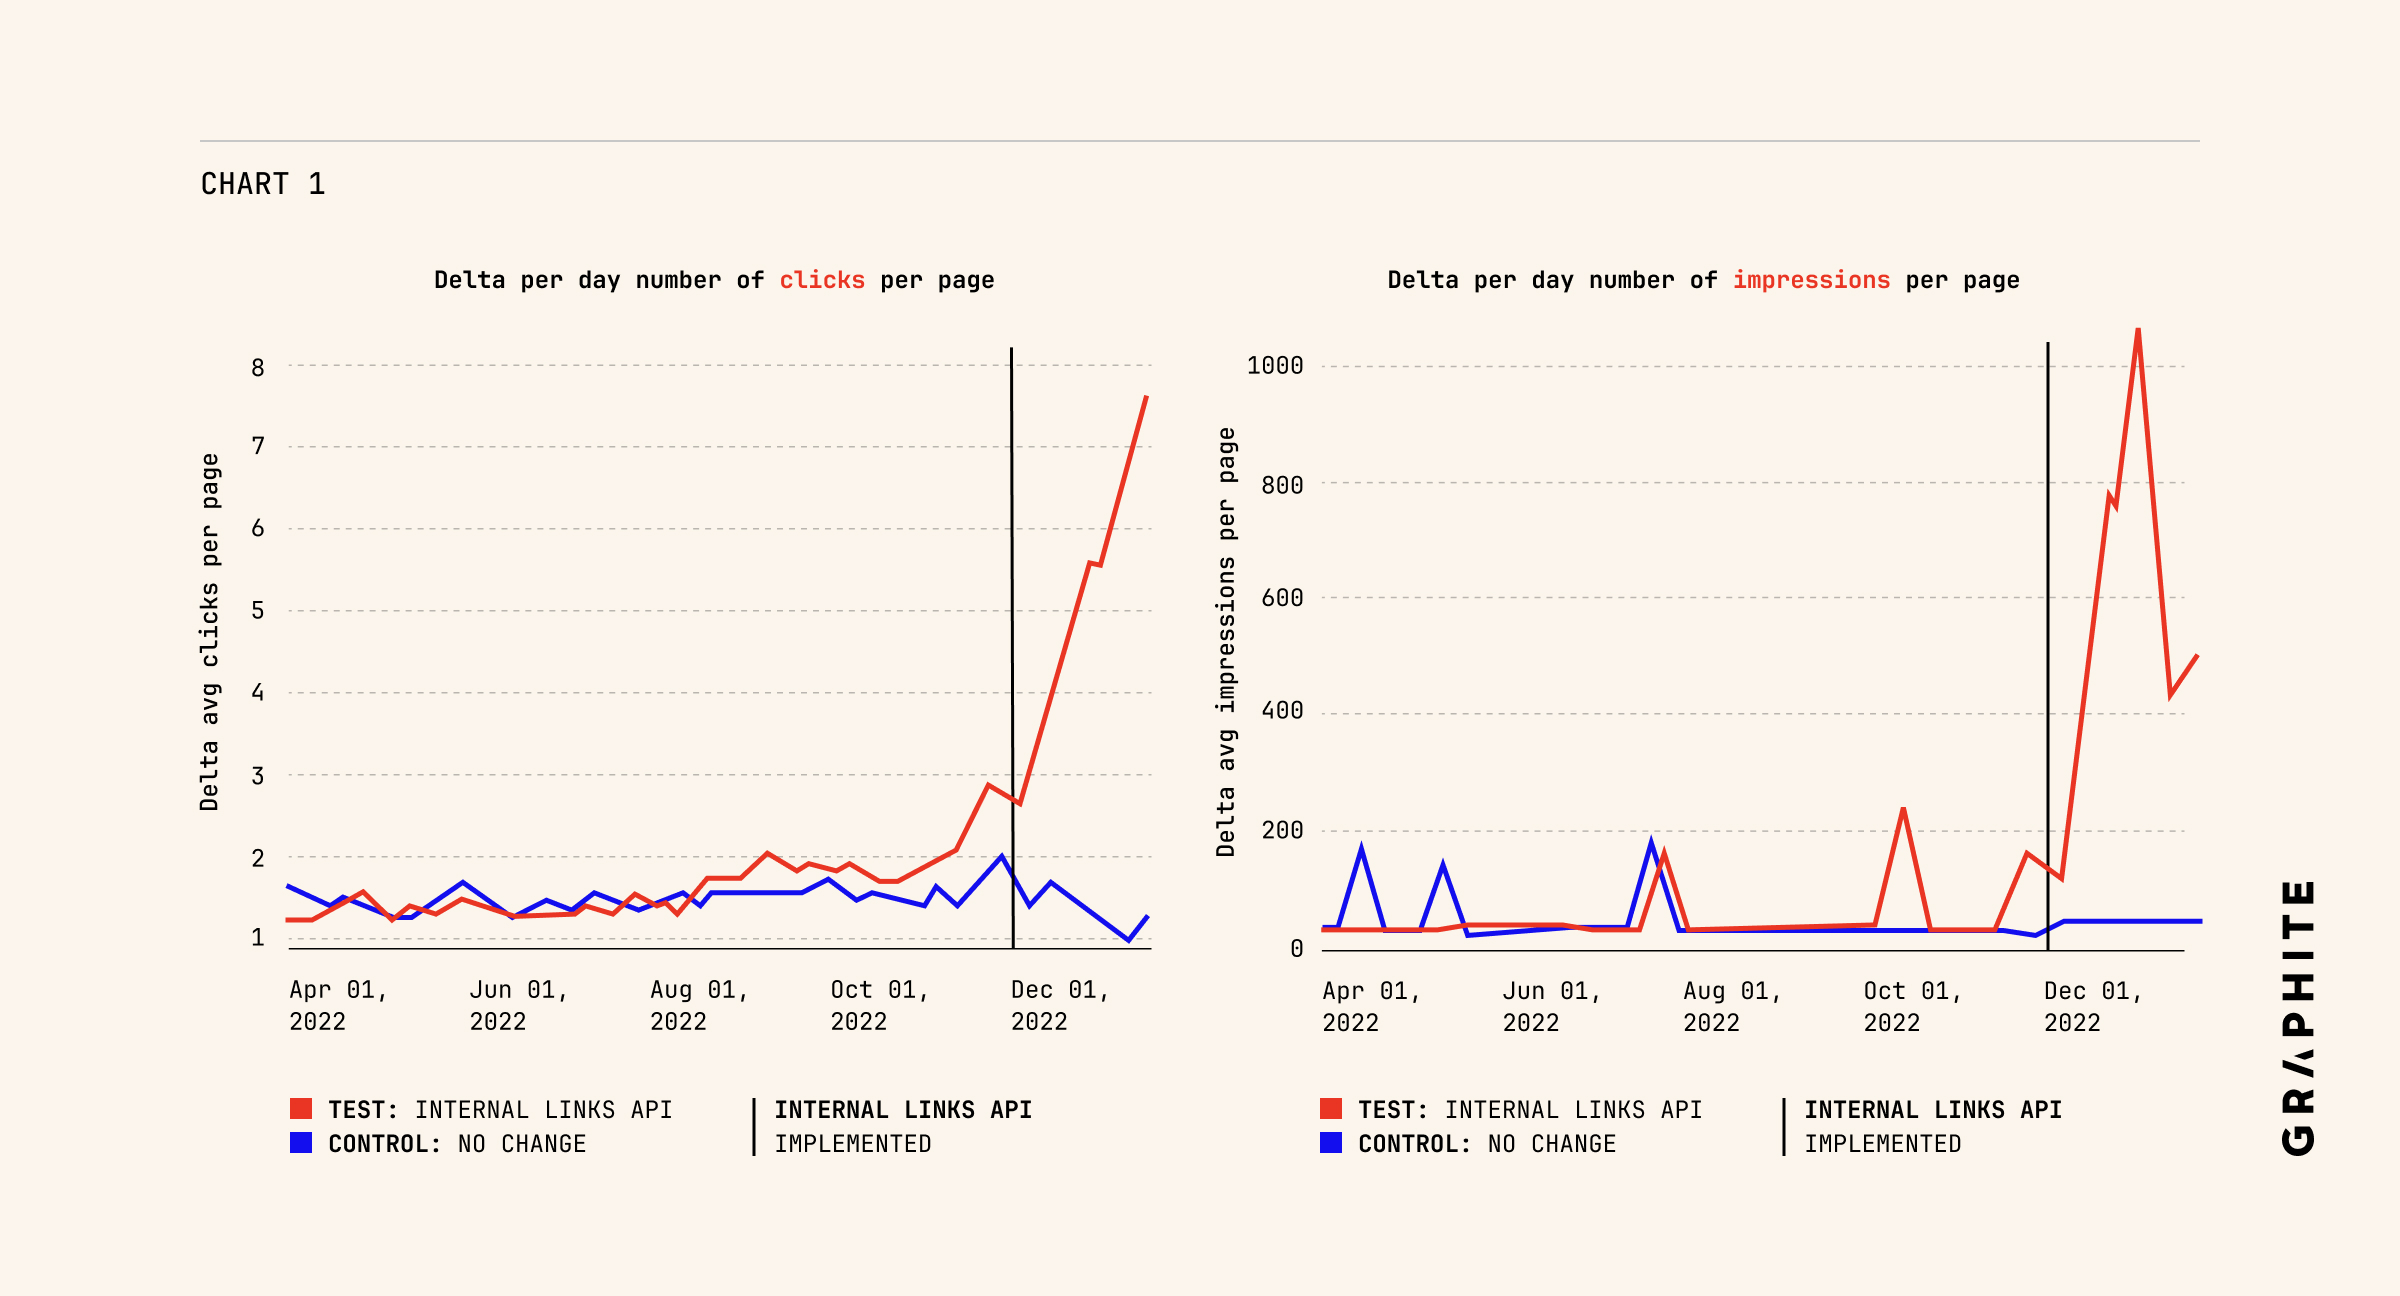
The impact was most significant on URLs that had the least amount of clicks and impressions before the test (Quartile I). The test group in this quartile observed a 172.4% in average daily clicks and 767.4% in average daily impressions.
It’s important to note that Quartile I's results were heavily influenced by one URL, which showed a dramatic increase in clicks and impressions. When we exclude this URL, the results are less dramatic. The remaining URLs within Quartile I still had an increase of 23.2% in average daily impressions, but average daily clicks decreased by 13.1%.
Methodologies
Graphite conducted the AB test between November 29, 2022, and January 10, 2023 on 199 URLs. The specific number of links and which links were selected were chosen by the client to create a representative sample:
- 99 Test URLs implemented the Internal Links API
- 100 Control URLs had no change
To gain deeper insights on the performance of the URLs, we divided the Test/Control sets into four subsets based on traffic volume. Each subset represented one quartile of the data set. This also allowed us to compare the performance between test and control within each quartile.
- Quartile I: 0-25% of URLs sorted by traffic volume
- Quartile II: 25-50% of URLs sorted by traffic volume
- Quartile III: 50-75% of URLs sorted by traffic volume
- Quartile IV: 75-100% of URLs sorted by traffic volume
The use of quartiles in this study enabled the identification of anomalies and provided insights into the performance of both high and low performers. It also allowed us to better understand the relationship between existing traffic performance and the impact of the Internal Links API.
Results
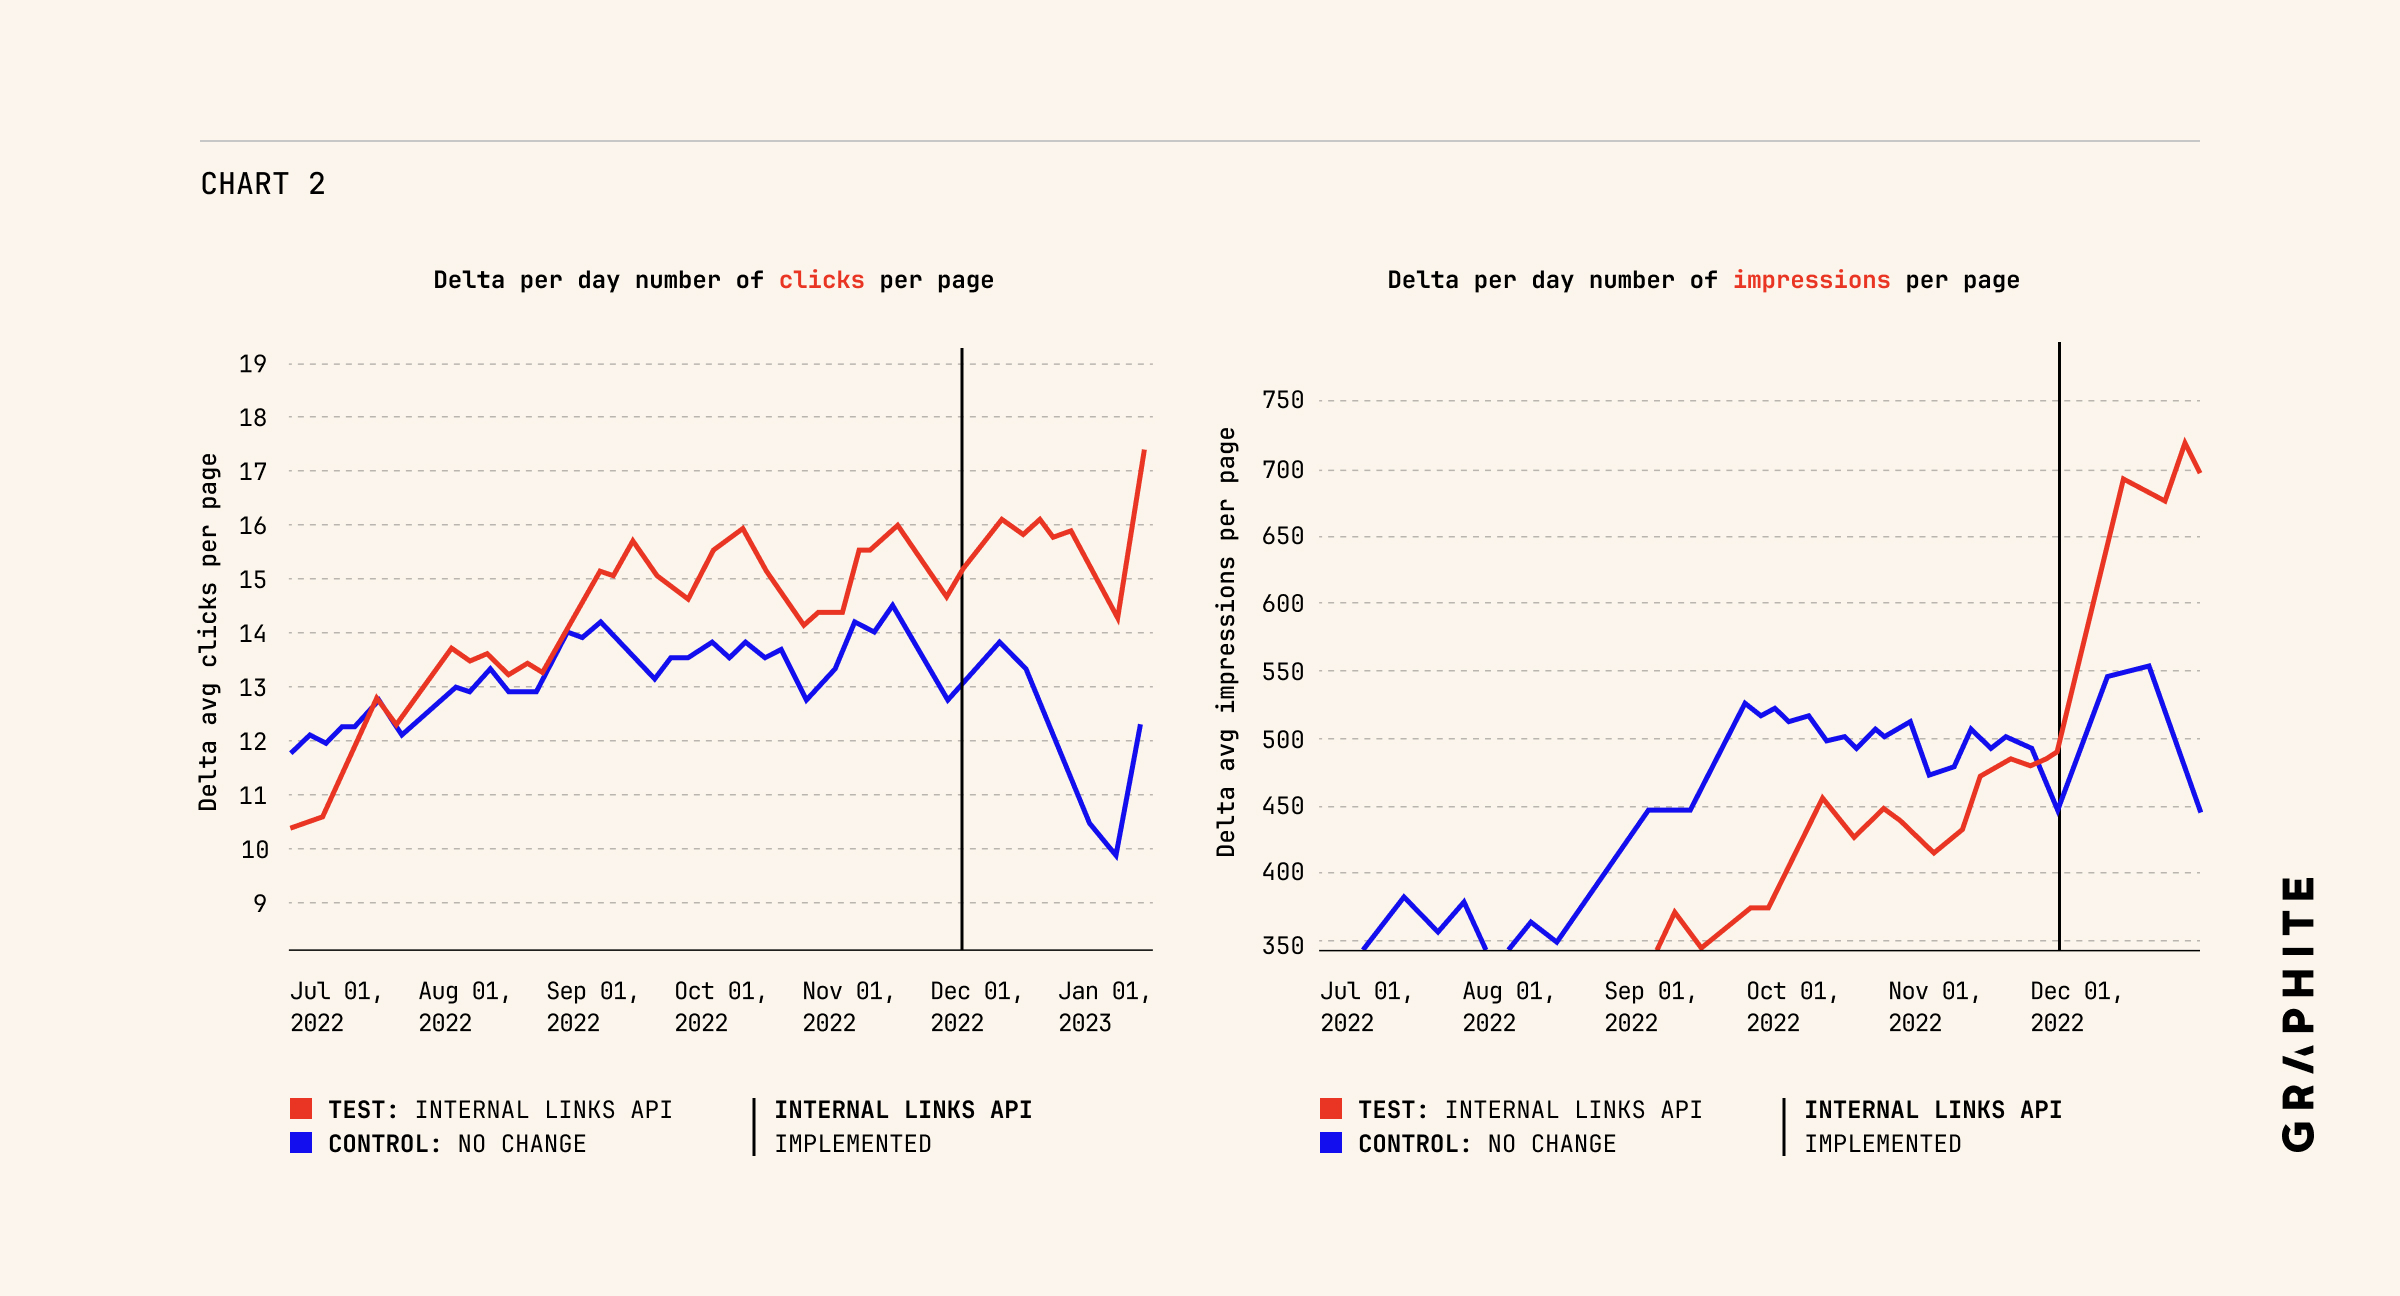
- Overall the test group experienced a 6.4% increase in average daily clicks and 42.4% average increase in daily impressions. By contrast, the control group decreased by 8.3% and increased by 0.7%, respectively.
- Quartile I of the test group experienced a dramatic 172.4% increase in average daily clicks and 767.4% in average daily impressions. The control group decreased by 12.6% and increased by 50.5%, respectively.
- Quartile II of the test group experienced a 14.5% decrease in average daily clicks and an increase of 9.9% in average daily impressions. The control group increased by 3.6% and 40%, respectively.
- Quartile III of the test group experienced a 4.8% decrease in average daily clicks and an increase of 11.3% in average daily impressions. The control group decreased by 10.3% and 8.5%, respectively.
- Quartile IV of the test group experienced a 1.9% increase in average daily clicks and 10.1% in average daily impressions. By contrast, the control group decreased by 8.7% and 1.2%, respectively.
Further Observations
The big increase in Quartile I (0%-25%) was primarily driven by one URL, which saw an increase from 10.1 average daily clicks to 112.8 average daily clicks. Average daily impressions went from 1,306.18 to 15,430.48. When excluding this URL, Quartile 1 (0%-25%) still observed a 23.2% increase in average daily impressions, but a decrease of 13.1% in average daily clicks.
Conclusion
In conclusion, the Internal Links API AB Test provided insightful data on its impact on website performance. The results indicate that within 50 days, the Internal Links API can lead to a significant increase in visibility, impressions, and clicks. There’s also a high probability of dramatic impact on URLs that receive little to no traffic, as seen in Quartile I of this study. This could be for newly launched content or for articles that previously lacked sufficient link coverage.
Reference
Internal Linking API - https://www.graphitehq.com/platform/internal-links-api

